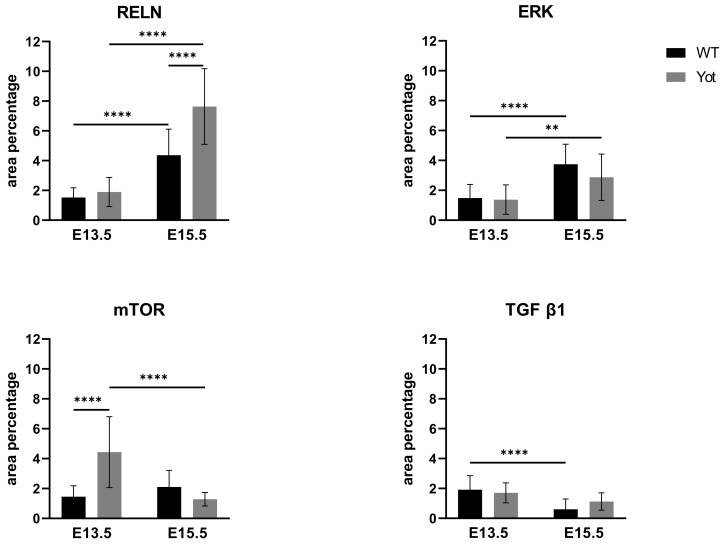
Figure 7.
The area percentages of reelin (RELN), ERK, mTOR and TGF β in wild type and yotari livers at gestation days E13.5 and E15.5. Data are presented as the mean ± SD (vertical line). Significant differences were indicated by ** p < 0.01, **** p < 0.0001. One-way ANOVA followed by Tukey`s multiple comparisons test.

