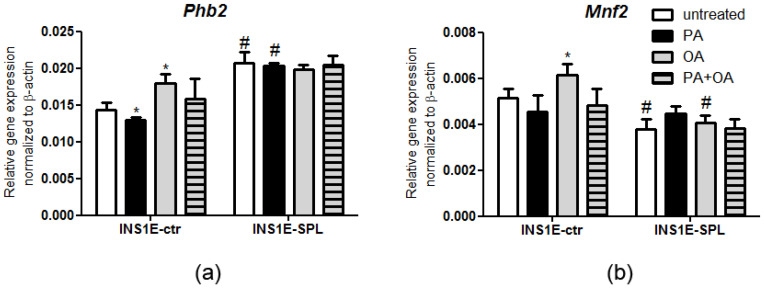
Figure 6.
Effects of SPL overexpression and free fatty acids on mitochondrial stress markers expression. INS1E cells were incubated in the absence or presence of 500 µM PA, OA or a combination of PA and OA (500 µM of each) for 24 h. Thereafter, RNA was isolated, cDNA was synthetized and real-time PCR was performed to detect (a) Phb2 and (b) Mnf2 expression. Shown are MEANS ± SEM from n = 4–6 independent experiments; each condition was measured in triplicate. ANOVA followed by Bonferroni, * p < 0.05 vs. untreated, # p < 0.05 vs. INS1E-ctr cells treated in the same way.

