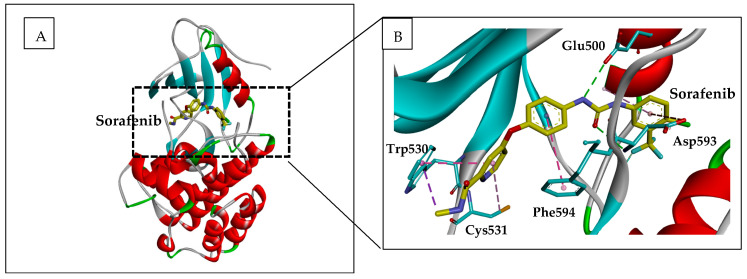
Figure 3.
Representation of Sorafenib in complex with B-Raf. (A) Ribbon representation of b-Raf in complex with Sorafenib (yellow sticks). The 3-D structure used (pdb code 1UWH) was uploaded from the protein data bank (https://www.rcsb.org/structure/1UWH). (B) zoom from A showing interacting residues (blue sticks) with Sorafenib in the active site of b-Raf. Figure was constructed using the BIOVIA Discovery Studio software (BIOVIA, Dassault Systèmes, [BIOVIA Discovery Studio], [v17.2.0.16349], San Diego: Dassault Systèmes, [2017]).

