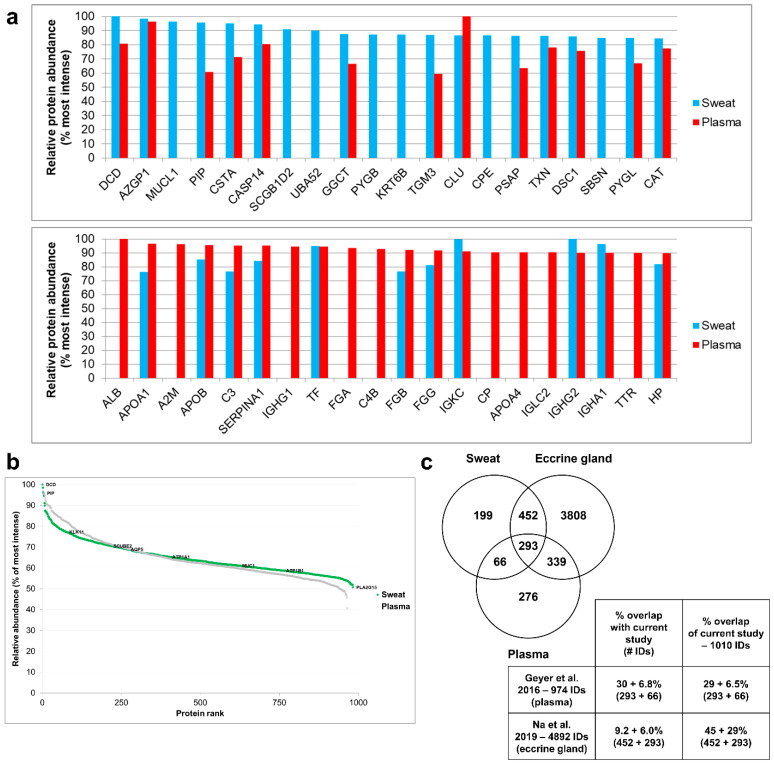
Figure 4.
Tissue contributions to sweat composition. (a) Most abundant proteins (top 20) of sweat, as found in the plasma proteome (upper panel); most abundant proteins of plasma, as found in the sweat proteome (lower panel). Relative protein abundance = % Log10 LFQ intensity of top 10. (b) Dynamic range of sweat compared to plasma. Most and least intense proteins as well as eccrine gland markers in sweat were annotated. (c) Protein identification overlap with plasma and eccrine cell lysate (all identified proteins). Contaminant proteins were kept for proteome comparison. Here, the reference proteome included 983 proteins of interest plus 3 standard proteins (MPDS Mix 1) and 24 contaminants, identified with a minimum of 2 peptides, including a minimum of 1 unique peptide. Plasma proteomic data were retrieved from Geyer et al. 2016. Eccrine gland cell proteomic data were retrieved from Na et al. 2019.

