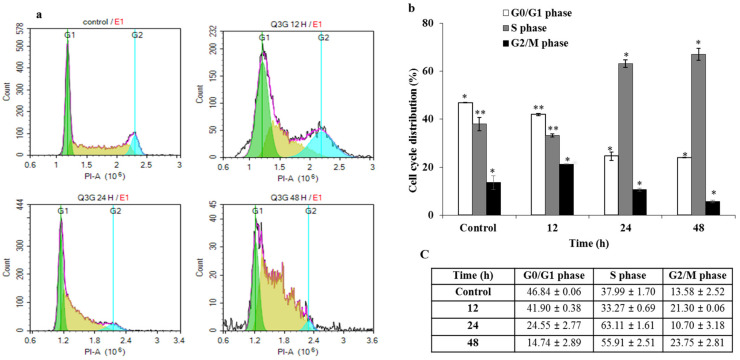
Figure 3.
Hela cell cycle analysis with PI: (a): After treatment with 30 µg of Q3G for 24 or 48 h, HELA cells were analyzed for cell cycle distribution with Novocyte flow cytometer. The representative plot shows cells in G0/G1 phase (green), S phase (yellow), and G2/M phase (blue). Compared to normal DMSO treated cells (Control), Q3G treated cells were arrested at S phase and G2/M phase. (b): Graph shows the percentages of cells in G0/G, S and G2/M phase. (c): Data in the table are mean ± SD of two independent experiments in triplicate. * p < 0.05, ** p < 0.01 indicate the significant differences from the control.

