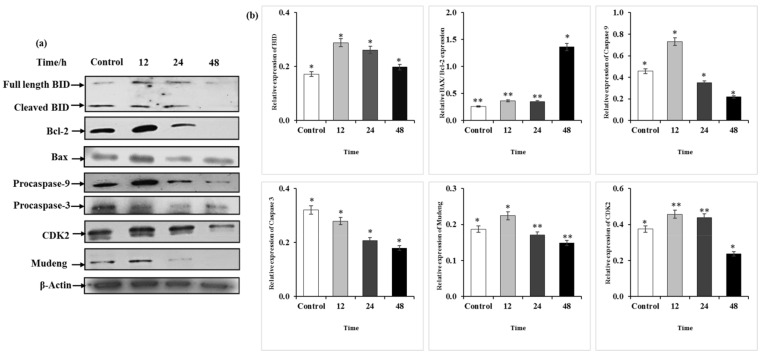
Figure 5.
Protein expression of Hela cells treated with Q3G. (a): Representative western blots of BID, Bcl-2, Bax, Caspase-3, Caspase-9, Cdk2, Mudeng, and β-actin. (b): Quantitative analysis of the expression in comparison to β-actin, an internal control. * p < 0.05, ** p < 0.01 indicate the significant differences from the control.

