Figure 1.
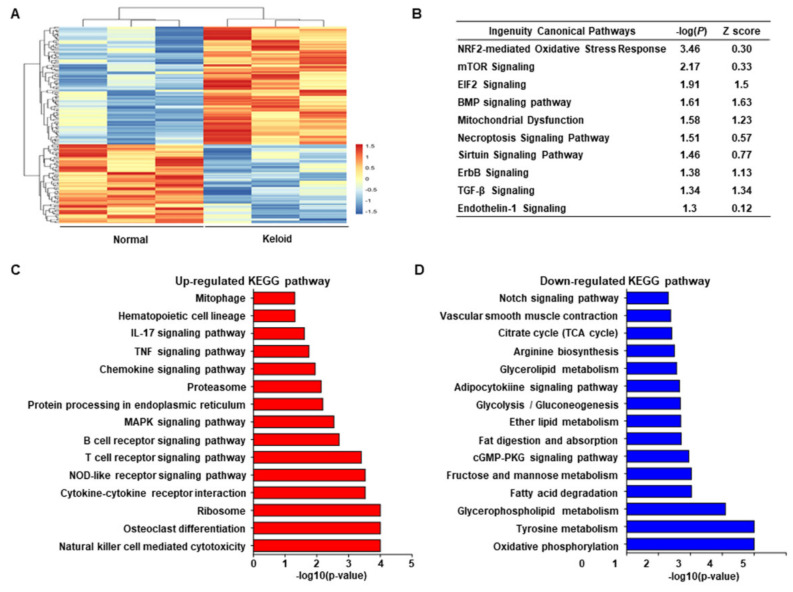
Transcriptomic analysis in keloid skin and normal skin (n = 3 for each group). (A) Repre–sentative heatmap image of differential gene expressions between keloid skin and normal skin. (B) Upregulated pathway in keloid using ingenuity pathway analysis (IPA). (C) Upregulated Kyoto Encyclopedia of Genes and Genome (KEGG) pathways in the keloid group compared to the normal group (p < 0.05). (D) Downregulated KEGG pathways in the keloid group compared to the normal group (p < 0.05).

