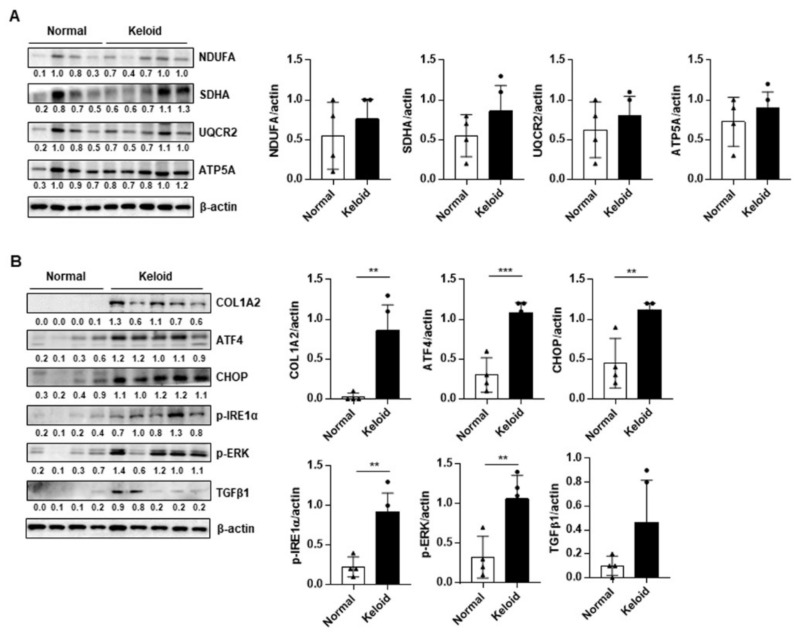
Figure 2.
Western blot analysis of OxPhos complex subunits and endoplasmic reticulum (ER) stress signaling between normal skin tissues (n = 4) and keloid tissues (n = 5). (A) Representative blot and densitometry analysis of OxPhos complex subunits in normal and keloid tissues (n = 3 biological replicates). (B) Representative blot and densitometry analysis of fibrosis markers and ER stress-related genes in normal and keloid tissues (n = 3 biological replicates). Significance was set at p < 0.05. ** p < 0.01, and *** p < 0.001.

