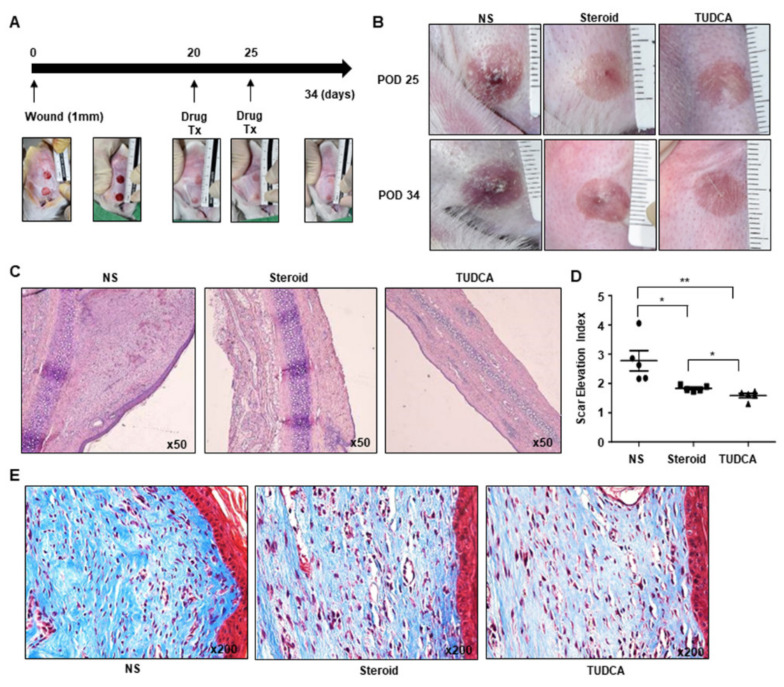
Figure 4.
Rabbit ear scar model and the effect of TUDCA injection on keloid formation, compared to normal saline (NS) and steroid injection (n = 5 for each group). (A) Drug injection schedule and gross images. (B) Gross images of the scarred regions treated with NS, steroid (10 mg/mL), and TUDCA (10 mg/mL). (C) Hematoxylin and eosin (H&E) staining of rabbit ear scar tissues from the NS, steroid, and TUDCA groups. (D) Scar elevation index (SEI) calculated based on H&E staining. (E) Masson’s trichrome staining of rabbit ear scar tissues from the NS, steroid, and TUDCA groups. Significance was set at p < 0.05. * p < 0.05 and ** p < 0.01.

