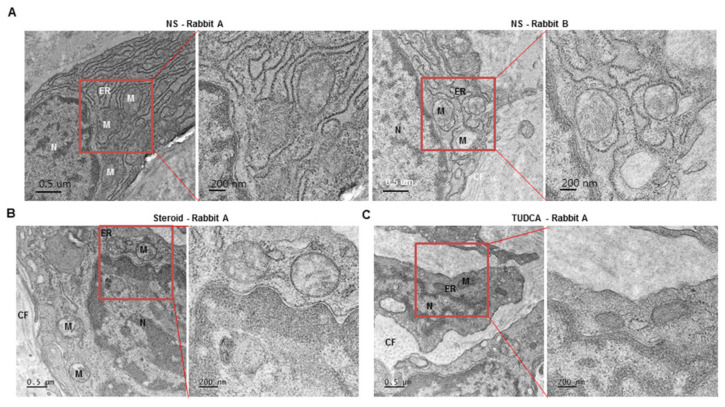
Figure 5.
Representative images of transmission electron micrographs of rabbit ear scar models (NS group = 4 rabbits, steroid group = 3 rabbits, TUDCA group = 3 rabbits). (A) normal saline, (B) steroid (10 mg/mL), and (C) TUDCA (10 mg/mL). M: Mitochondria, ER: Endoplasmic Reticulum, CF: Collagen Fiber, N: Nucleus (See Supplementary Figure S3).

