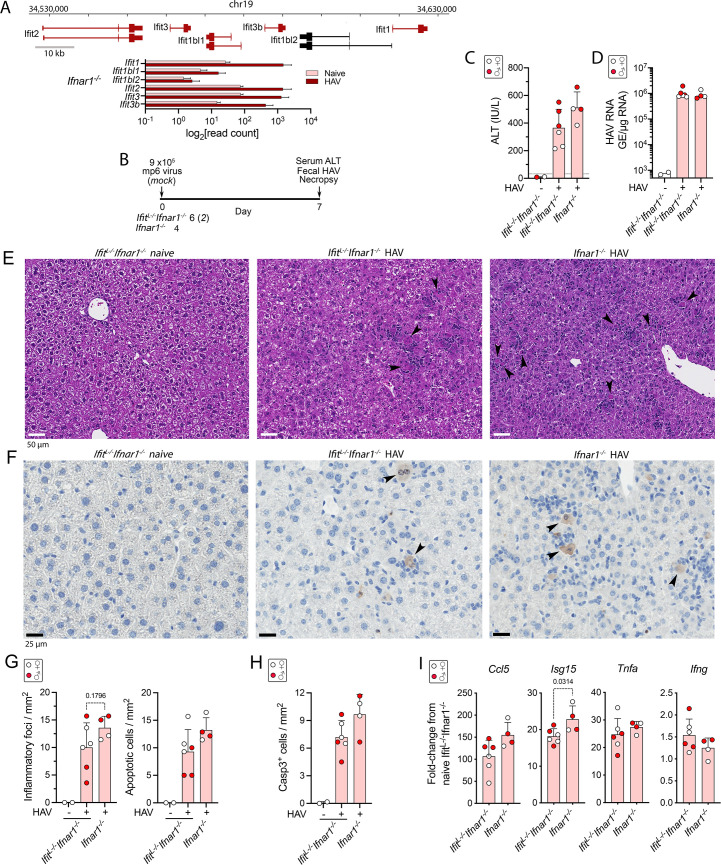
Fig 2. HAV infection of Ifit locus knockout IfitL-/-Ifnar1-/- and Ifnar1-/- mice.
(A) Ifit gene locus in chromosome 19, showing exons and introns related to major transcripts encoding IFIT proteins. Transcripts identified by high-throughput sequencing in naïve and HAV-infected mouse liver are colored red. At the bottom are shown the normalized Ifit locus transcript read counts in livers of naïve and HAV-infected female Ifnar1-/- mice (n = 4). (B) Experimental scheme showing numbers of HAV- and mock-infected IfitL-/-Ifnar1-/- and Ifnar1-/- mice. Mice were necropsied 7 days after i.v. inoculation (dpi) of 9 x10⁵ genome equivalents (GE) of HM175-mp6 virus. (C) Serum ALT activities in mock-infected and HAV-infected IfitL-/-Ifnar1-/- mice versus HAV-infected Ifnar1-/- mice. In this and other panels, male animals are indicated by solid red symbols, and female animals by open symbols. (D) Intrahepatic HAV RNA abundance 7 dpi determined by RT-qPCR GE = genome equivalents. (E) Representative H&E stained liver sections from naïve and HAV-infected IfitL-/-Ifnar1-/- and Ifnar1-/- mice. (F) Representative immunohistochemically stained liver sections demonstrating cells with intracellular cleaved caspase 3 (arrows). (G) Foci of inflammation (left) and apoptotic hepatocytes (right) observed by a blinded liver pathologist in H&E-stained sections of liver collected at necropsy of naïve and infected mice. (H) Mean number of hepatocytes staining positively for cleaved caspase 3 per mm2 in liver tissue collected at necropsy. (I) Cytokine transcript abundance in liver tissue collected at necropsy. Error bars in all panels indicate s.d.; p-values are shown only when <0.05 in 2-way comparisons by two-sided t test or ANOVA with Šidák’s test for multiple comparisons.

