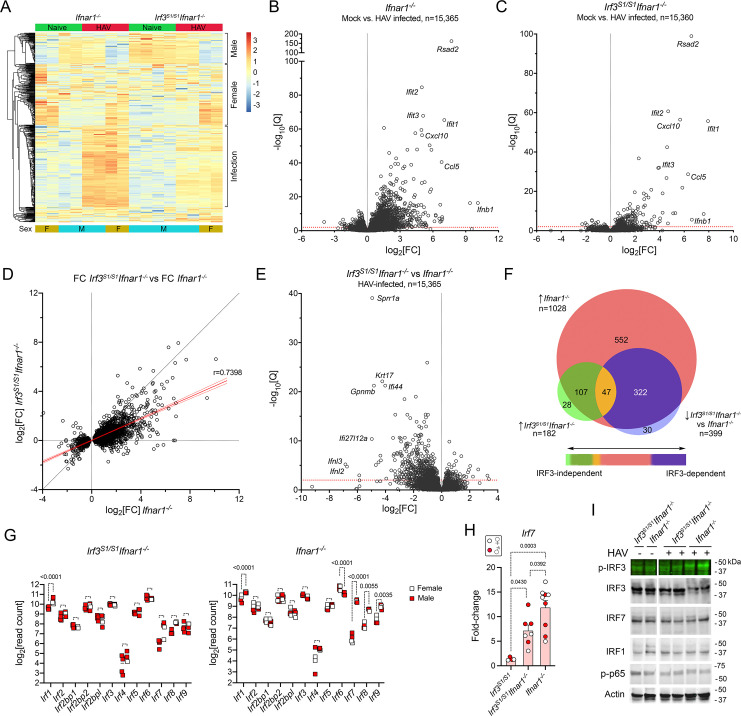
Fig 4. Changes in the intrahepatic transcriptome of HAV-infected Irf3S1/S1Ifnar1-/- mice.
(A) Heat map showing changes in abundance of the top 500 differentially-expressed genes (ranked by variance of standardized read counts) in naïve and HAV-infected Irf3S1/S1Ifnar1-/- and Ifnar1-/- mice; n = 4 in each group selected for high-throughput RNA sequencing. Transcripts differentially expressed in relation to sex or HAV infection are noted on the right. The scale on the right represents z-score. (B, C) Volcano plots showing fold-change (fc) and significance of changes in transcripts of genes with at least 10 reads mapped in RNA from naïve versus HAV-infected liver tissue from (B) Ifnar1-/- and (C) Irf3S1/S1Ifnar1-/- mice. Q = adjusted p-value. (D) Correlation of fold-change (log2[FC]) observed in abundance of 2,503 differentially expressed transcripts in HAV-infected Irf3S1/S1Ifnar1-/- mice versus Ifnar1-/- mice. Red line = simple linear regression, ±95% C.I.; slope = 0.4415; Spearman r = 0.7398, p<0.0001. (E) Volcano plot showing fold-change and significance of infection-induced differences in intrahepatic RNA transcripts in Irf3S1/S1Ifnar1-/- versus Ifnar1-/- mice. (F) Venn diagram showing overlap of genes upregulated by infection in Ifnar1-/- and Irf3S1/S1Ifnar1-/- mice. (G) Normalized read counts of interferon regulatory factor transcripts in mock versus HAV-infected (left) Irf3S1/S1Ifnar1-/- and (right) Ifnar1-/- mice. Significance determined by two-way ANOVA with Šídák’s multiple comparisons test. (H) Infection induced fold-change in Irf7 transcript abundance determined by RT-qPCR. Fold increase for Irf3S1/S1 was 1.38 ± 0.31 s.d. Solid red symbols represent male animals. (I) Immunoblots of interferon regulatory factors, including phosphorylated IRF3 (p-IRF3, Ser396), and phosphorylated RELA (p-p65) in extracts of liver tissue from naïve and HAV-infected (left) Irf3S1/S1Ifnar1-/- and (right) Ifnar1-/- mice.

