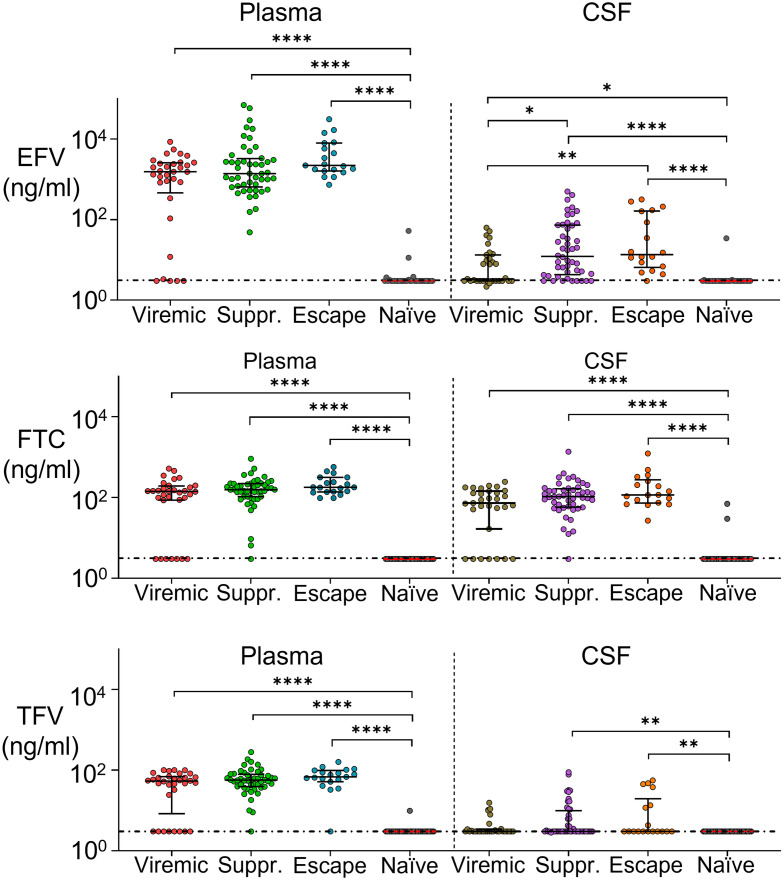
Fig 5. ART concentrations in plasma and CSF are similar in individuals with full suppression and CSF escape.
Medians and IQR of EFV, FTC, and TFV concentrations in the plasma (left) and CSF (right) in individuals who were viremic on ART (plasma n = 32, CSF n = 31), suppressed (plasma and CSF n = 48), showed CSF escape (plasma n = 19, CSF n = 18), or were reported as treatment naïve (plasma n = 33, CSF n = 31). Horizontal dotted line indicates limit of detection (3 ng/mL). p-values are: *< 0.05; **< 0.01; ****< 0.0001 using the Kruskal-Wallis test with Dunn multiple comparison correction.

