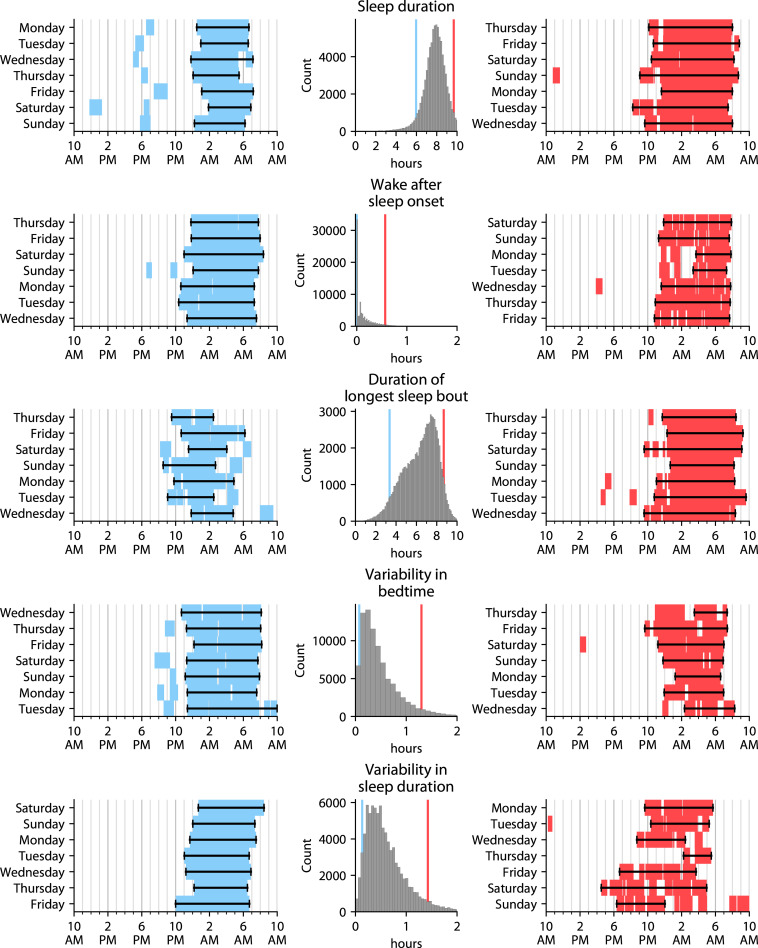
Fig 1. Distributions and exemplar individuals for various sleep measures.
Each row’s middle panel shows a 100-bin histogram and Gaussian kernel density estimate of a particular sleep measure across the self-reported white participants. For each measure, 2 exemplar individuals were chosen: one at the 5th percentile (plotted to the left of the histogram), and one at the 95th percentile (plotted to the right of the histogram). The blue (left) and red (right) lines on the histograms denote the 5th and 95th percentiles, i.e., where these 2 exemplar individuals are located on the distribution. In the exemplar plots, blue/red blocks indicate sleep bouts, and black lines with bars indicate each day’s primary sleep period. Days of the week are ordered differently for different exemplars because some people started the accelerometry on different days.

