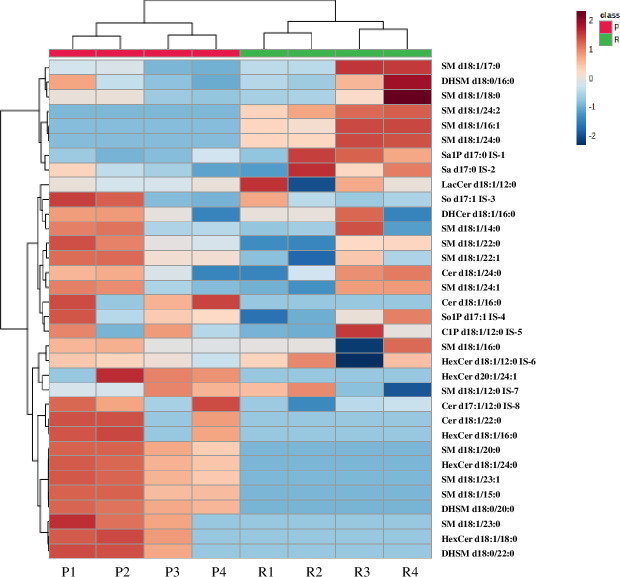
Fig 2. Heatmap showing the levels of SPLs in parental and dox-resistant MCF7 cells.
The columns represent the type of cell line (P1-4 represents parental MCF-7 independent samples) and (R1-4 represents dox-resistant MCF-7 independent samples), while the rows represent the SPLs species. The color scale from blue to maroon represented the reduction and elevation in the levels of SPLs with respect to the median value of the intensity level. The red color indicated parental MCF-7 cells, while green indicated dox-resistant MCF-7 cells.

