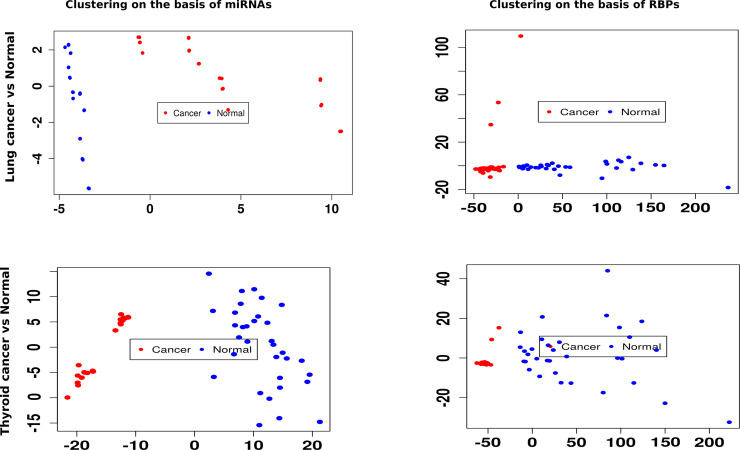
Fig 5. miRNAs and associated RBPs distinguish between cell lines similarly.
This set of plots displays the discrimination between lungs cancer vs normal samples and thyroid cancer vs normal samples based on k-means clustering on miRNAs and associated RBPs, separately. The associated miRNAs and RBPs gave similar results, reflecting their functional association.

