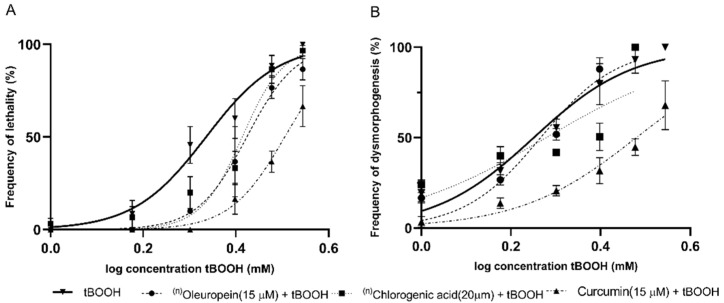
Figure 3.
Concentration–response curves produced using tBOOH in combination with different polyphenolic compounds for (A) lethality, and (B) dysmorphogenesis. (n)Note: the absence of points on the graph at higher concentrations is because they already produced a 100% embryo lethality in all replicates.

