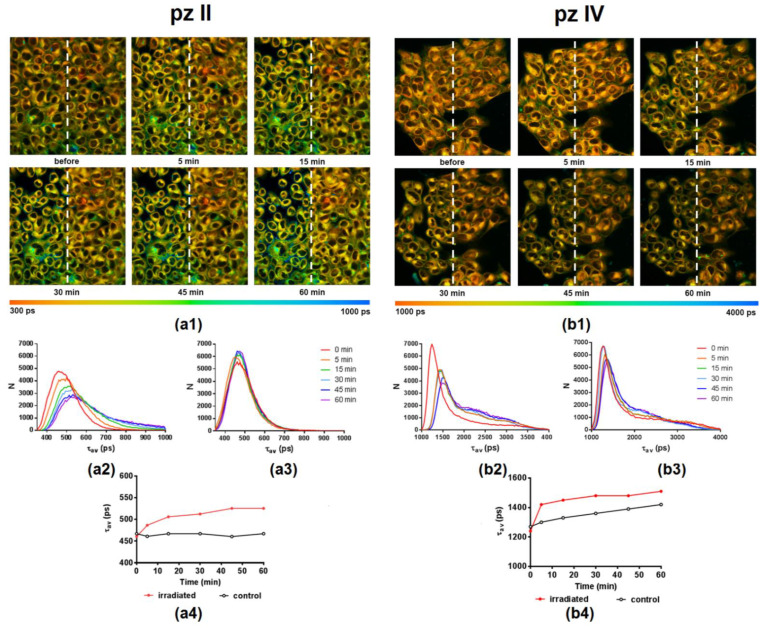
Figure 10.
Representative FLIM images illustrating pz II’s (a1) and pz IV’s (b1) fluorescence lifetime (τav) distribution in human epidermoid carcinoma A431 cells before and at different time points after PDT treatment. Photodynamic exposure (594 nm, 20 J/cm2) was performed in the left half of the field of view; irradiated and control areas are divided by a white dotted line. λex, 800 nm, λem, 652–740 nm. The color scale range is between 300 and 1000 ps for pz II and 1000 and 4000 ps for pz IV. Image size, 212 × 212 μm. The distribution histograms of a fluorescence lifetime (τav) in irradiated and control regions for pz II (a2,a3) and pz IV (b2,b3) and the plot of τav vs. time after irradiation (a4,b4) are shown.

