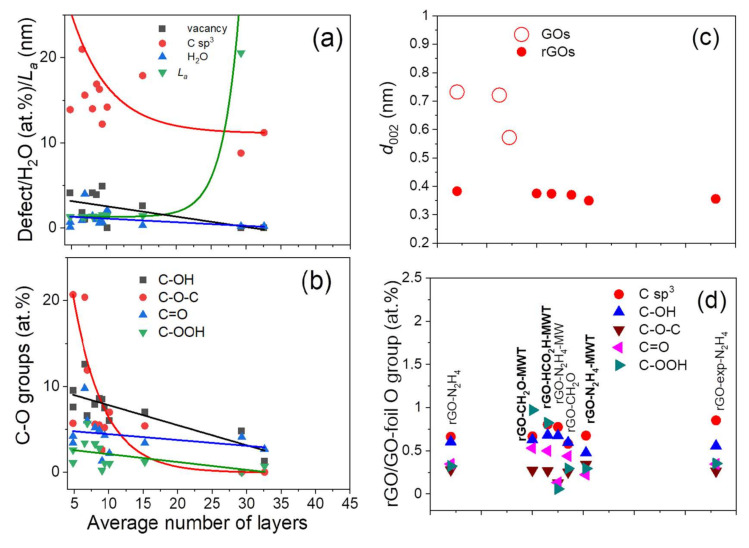
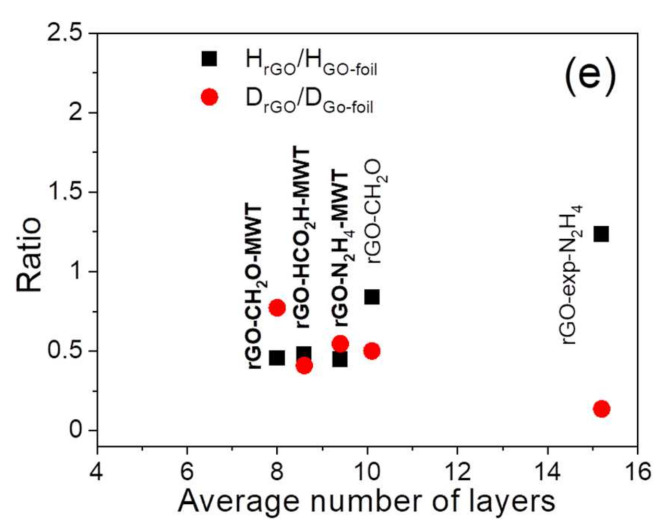
Figure 8.
(a) Surface atomic content of vacancy, C sp3 defects, adsorbed H2O and effective crystallite size in direction of graphite plane La, (b) carbon-oxygen groups content, (c) distance between graphene layers, d002, (d) ratio of rGO to GO-foil oxygen group content determined from C 1s spectra fitting (Table S2), (e) ratio rGO to GO-foil flakes height and diameter resulting from XRD (Table 1) as a function of the average number of layers.


