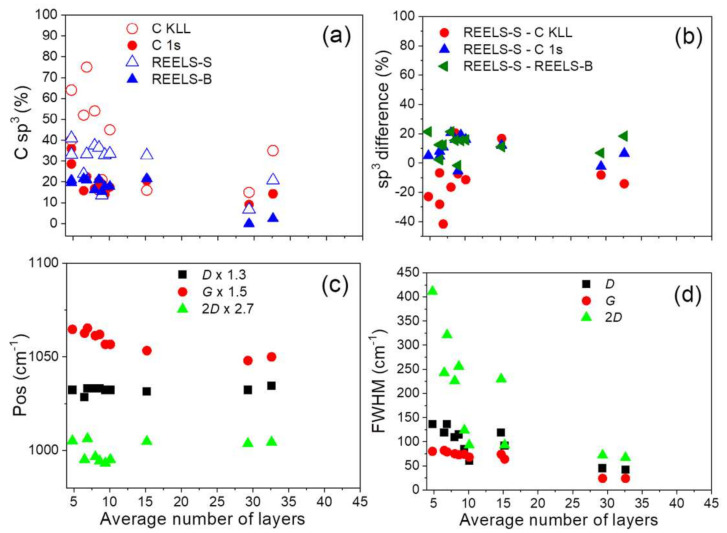
Figure 9.
(a) C sp3 content determined from C KLL AES spectra and parameter D (Table 4), C 1s spectra fitting (Table S2) and REELS-surface (REELS-S) and REELS-bulk (REELS-bulk) components (Table 3), (b) the respective differences, Raman spectra D, G, 2D modes (c) positions (Table 2) and (d) FWHMs (Table 2) dependent on the average number of layers in the investigated samples.

