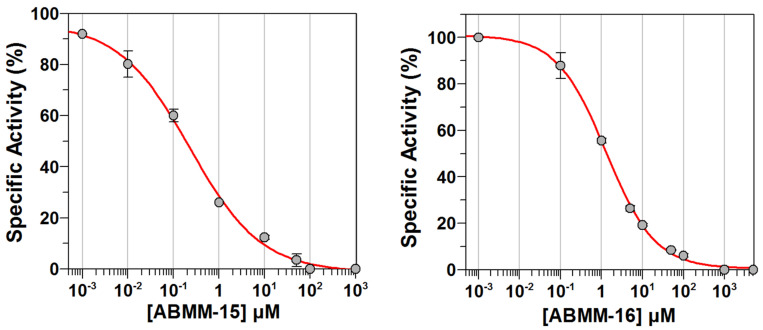
Figure 2.
Representative sigmoidal curves to calculate the IC50 values of ABMM-15 (left) and ABMM-16 (right) against ALDH1A3 at a saturating concentration of hexanal (250 µM). The percentage of specific activity is plotted against the logarithm of inhibitor concentration. Experimental values are shown as the mean ± SE of duplicate experiments.

