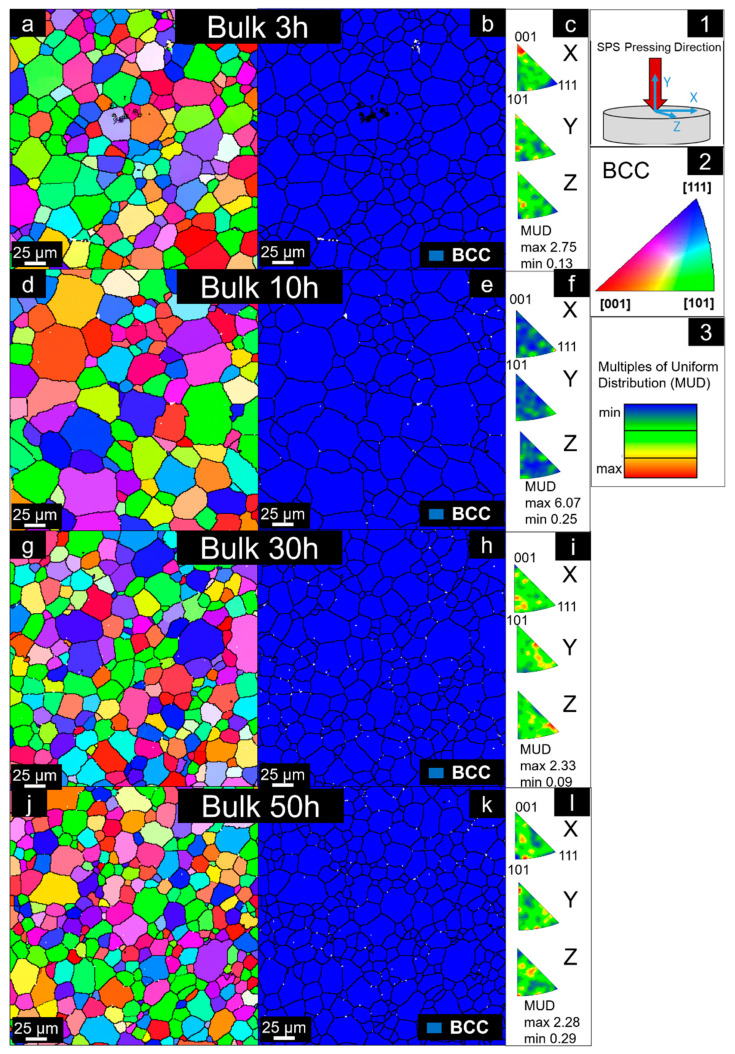
Figure 8.
Representative EBSD results of Al0.3NbTa0.8Ti1.5V0.2Zr sintered bulks subject to different powder milling times. (a,d,g,j) Inverse pole figure showing grain orientation maps with reference direction perpendicular to the SPS compaction direction denoted as Z in (1), for 3, 10, 30 and 50 h, respectively. The colors represent the directions shown in (2). (b,e,h,k) Phase map showing distribution of BCC grains (white regions represent dispersed oxides), for 3, 10, 30 and 50 h, respectively. (c,f,i,l) Inverse pole figures of BCC phase. MUD reference is shown in (3).

