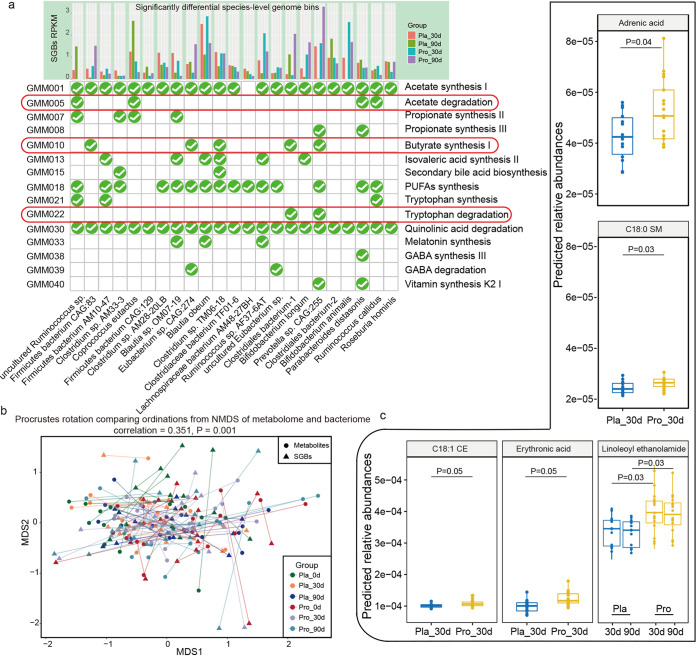
FIG 3.
Changes in the profiles of gut metabolic modules (GMMs) and predicted metabolites at days 30 and 90. (a) Distribution of selected GMMs (relating with asthma development, pathophysiology, and immune system) in significant differential species-level genome bins (SGBs) between the probiotic (Pro) and the placebo (Pla) groups. The check mark circle represents the presence of the specific GMM in the corresponding SGB. (b) Procrustes analyses performed on the predicted microbiomes and metabolomes of the probiotic (Pro) and placebo (Pla) groups at day 0 (0d), day 30 (30d), and day 90 (90d), showing a positive cooperativity between the microbiome and metabolome profiles (correlation = 0.351; P = 0.001). (c) Boxplots showing the contents of predicted differential bioactive metabolites that were responsive to the probiotic adjuvant treatment. Benjamini-Hochberg procedure-corrected P values between sample pairs are shown, and a corrected P value of <0.05 was considered statistically significant.

