FIG 4.
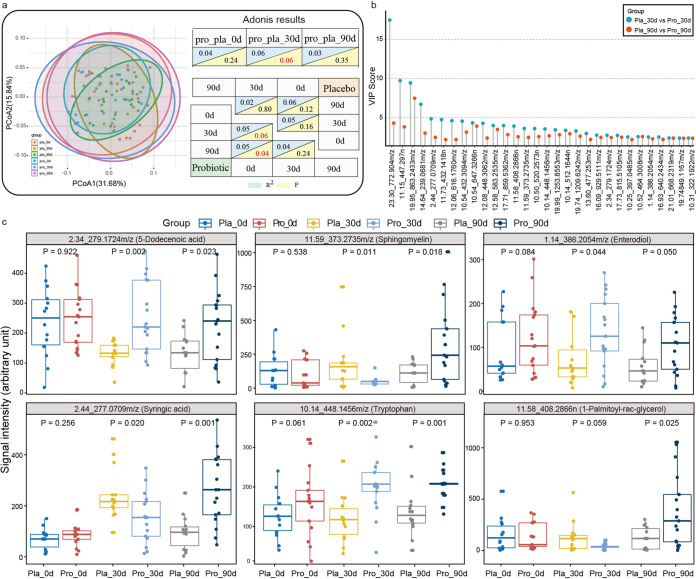
Changes in serum metabolomes of asthmatic patients during and after the intervention. (a) Principal coordinates analysis (PCoA) score plots and Adonis results of the probiotic (Pro) and placebo (Pla) groups at days 0 (0d), 30 (30d), and 90 (90d). Symbols representing samples of the placebo and probiotic groups at different time points are shown in different colors. Significant differences between groups were evaluated by Adonis test, and P values generated by pairwise comparison are shown. (b) Significant differential metabolites detected by liquid chromatography/mass spectrophotometry (LC/MS) at days 30 (30d) and 90 (90d) between the probiotic (Pro) and placebo (Pla) groups. No significant difference was found in the quantities of these metabolites between the two groups at day 0. The variable importance in projection (VIP) scores were generated by partial least-squares-discriminant analysis (PLS-DA) of metabolomic data sets of the two groups. (c) Box plots showing comparison between levels of serum metabolites that were responsive to the probiotic adjuvant treatment. Benjamini-Hochberg procedure-corrected P values between sample pairs are shown, and a corrected P value of <0.05 was considered statistically significant.

