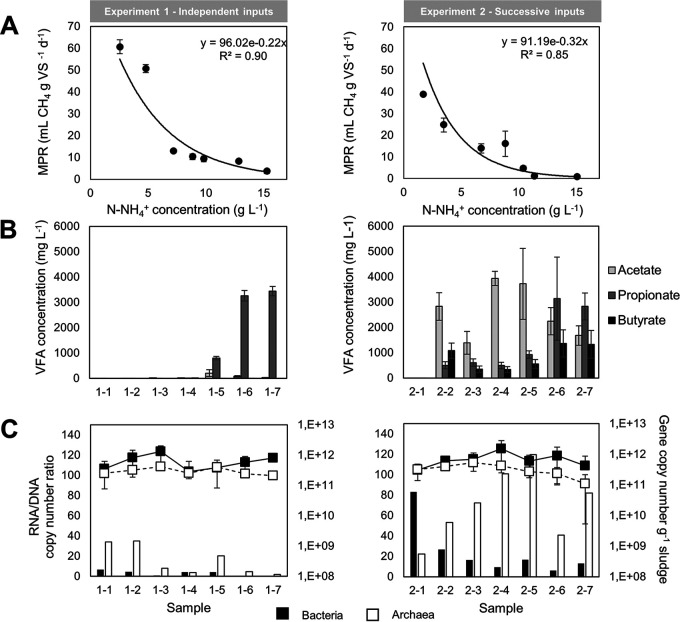
FIG 2.
(A) Methane production rate (MPR) in experiment 1 (independent N inputs) and experiment 2 (successive N inputs) for each ammonium condition. MPR was calculated as the maximal slope of methane production kinetics along time (Fig. S1). Mean and standard deviation were calculated on 6 and 6 to 24 replicates for experiments 1 and 2, respectively. (B) Volatile fatty acid (VFA) concentration in experiments 1 and 2 (the N-NH4+ concentration corresponding to each sample number is given in Table 1). VFA concentrations were measured at the time of maximal methanogenic activity (end of exponential phase), and mean and standard deviation were calculated from triplicated incubation vials. (C) Abundances of present (DNA-based) bacteria and archaea for each N-NH4+ level in experiment 1 and 2, represented as dots. Mean and standard deviations were calculated from technical duplicates on biological duplicates (i.e., n = 4). For each condition, the transcript-to-gene ratio (cDNA/DNA), indicative of active expression level, is represented as bars.

