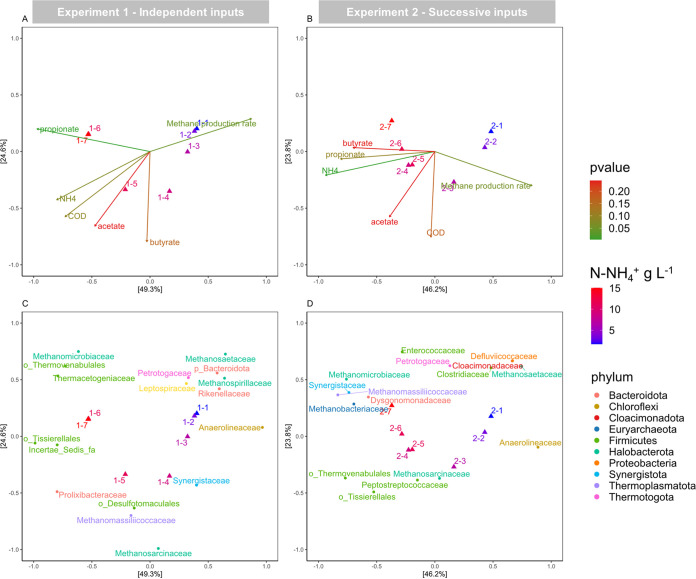
FIG 5.
Principal coordinate analysis (PCoA) of the active microbial community in experiment 1 (independent ammonium inputs, panels A and C) and experiment 2 (successive ammonium inputs, panels B and D) based on Bray-Curtis dissimilarities. For each sample, the input ammonium concentration is indicated by the symbol color gradient. Duplicates are aggregated by the mean. (A and B) Correlation of the ordination with environmental and functioning variables (significance tested by envfit function, P value represented by the arrow color gradient). (C and D) Representation of the 50 most abundant ASVs from the active community of each experiment, aggregated at the family level and colored by phylum.

