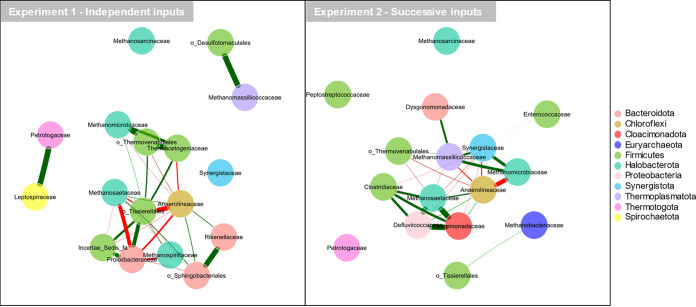
FIG 7.
Co-occurrence networks of the 50 most abundant ASV aggregated at the family level, for (A) experiment 1 (independent inputs) and (B) experiment 2 (successive inputs), based on Pearson correlations. The thickness of the lines is proportional to the Pearson correlation coefficient R. Only correlations with |R| of >0.8 and P value of <0.05 are shown. Positive and negative correlations are shown by red and green lines, respectively. The nodes are colored according to the taxonomic affiliation at the phylum level.

