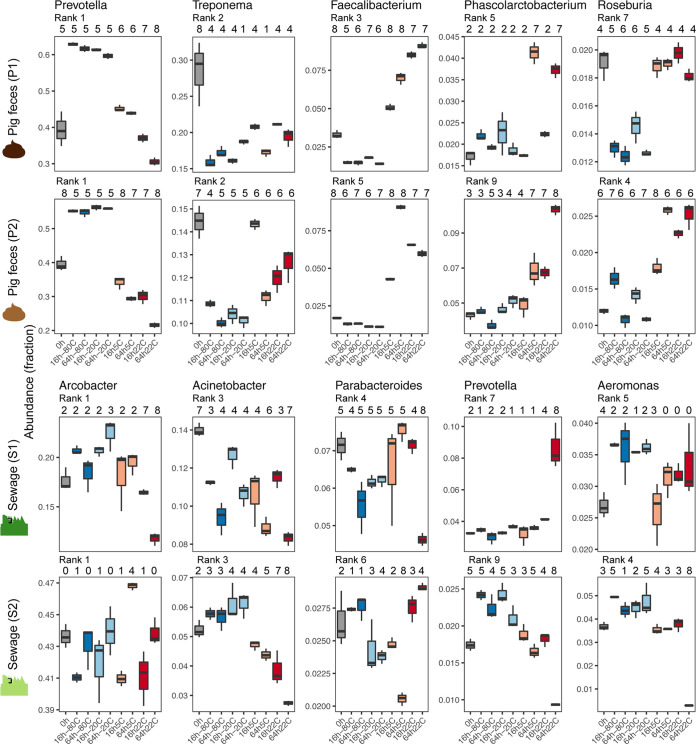
FIG 4.
Box plots displaying the abundance of selected highly abundant bacteria in unspiked pig feces (P1 and P2) and sewage (S1 and S2) samples. The abundance rank is indicated for each genus in the specific sample. Differential abundance between the storage conditions was tested pairwise using DESeq2, and the number of times a storage condition was significantly different (P < 0.01) from another is indicated above the box plots.

