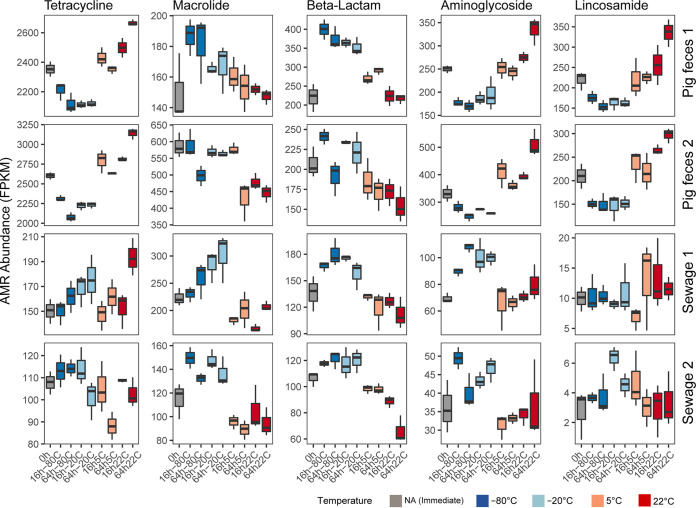
FIG 6.
The effect of storage on the abundance of antimicrobial resistance classes. Box plots displaying total antimicrobial resistance (AMR) abundance for the most abundant antimicrobial resistance classes in the unspiked samples (P1, P2, S1, and S2). The abundance was measured in FPKM relative to the total number of bacterial reads. For the results of the spiked samples, see Fig. S14 in the supplemental material.

