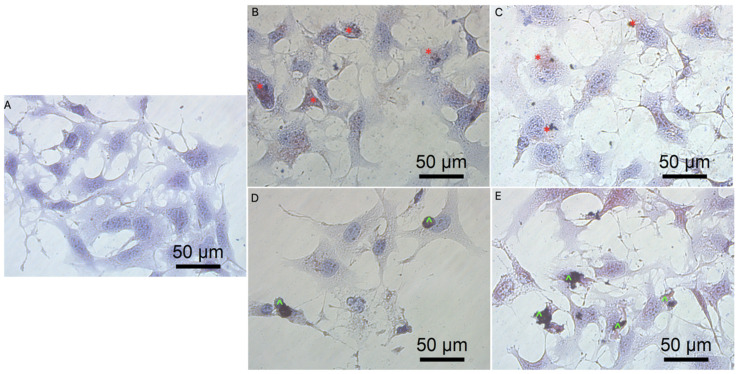
Figure 8.
Morphology of T98 glioblastoma cells. (A) untreated cells (control group), cells treated with graphene oxide at concentration: 5 μg/mL (B), 100 μg/mL (C), and reduced graphene oxide at concentration: 5 μg/mL (D) and 100 μg/mL (E). Red * GO at cell membrane. Green ^ rGO at cell membrane. Light optical microscopy. Scale bars: 50 μm. (A–E). Abbreviations: GO: graphene oxide, rGO: reduced graphene oxide.

