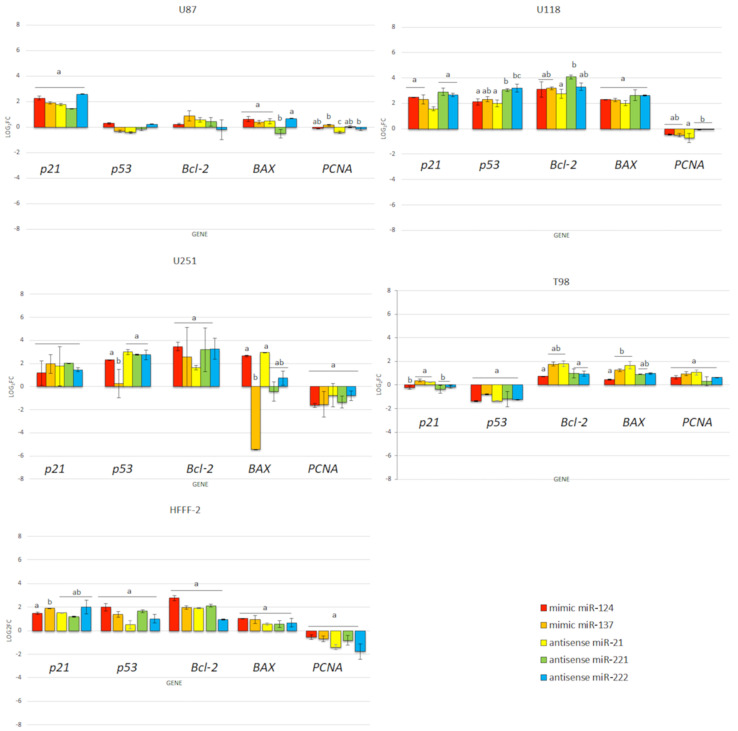
Figure 12.
Expression of genes p21, p53, Bcl-2, BAX and PCNA at the mRNA level in U87, U118, U251 and T98 glioblastoma and HFFF-2 fibroblast cells 24 h post transfection by electroporation using RT-PCR. Bars represent means with standard deviation (SD) (n = 3). Relative expression was calculated using the gapdh gene and the control group (0). The results are presented as log2FC values. Values above/below 0 indicate upregulation/downregulation of gene expression. FC fold change. Notes: Different lowercase letters (a, b) within columns indicate significant differences between the miRNA (p < 0.05).

