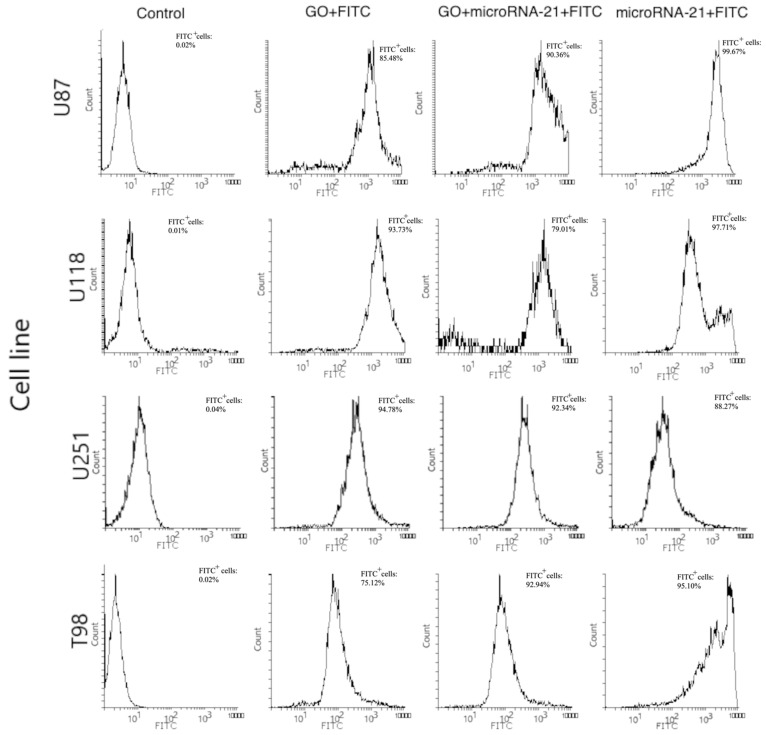
Figure 17.
Flow cytometric analysis of unstained and FITC-stained cells of U87, U118, U251, T98. Forward scatter (FSC) vs. side scatter (SSC) two-dimensional (2D) dot plots of unstained cell population (Control), FITC-labelled GO cell population (GO + FITC), FITC-labelled GO + antisense miRNA-21-stained cell population (GO + miRNA-21 + FITC), FITC labelled antisense miRNA-21-stained cell population (miRNA-21 + FITC). Abbreviations: FITC+—FITC positive cells.

