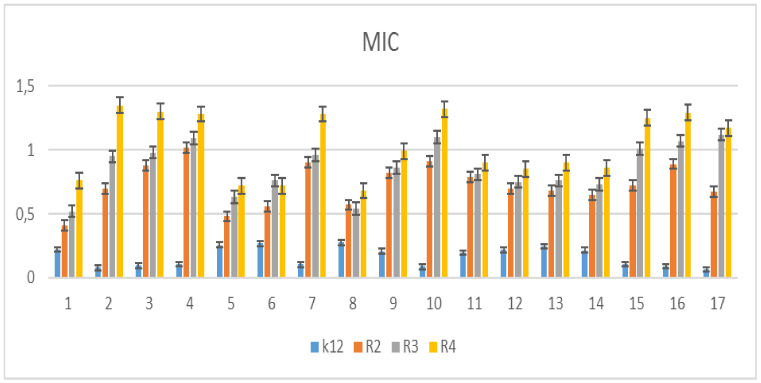
Figure 3.
Minimum inhibitory concentration (MIC) of the coumarin derivatives in model bacterial strains. The x-axis features coumarin derivatives 1–17 used sequentially. The y-axis shows the MIC value in µg/mL−1. Investigated strains of E. coli K12 as control (blue), R2 strains (orange), R3 strain (grey), and R4 strain (yellow). The y-axis shows the MBC value in µg/mL−1. The order in which the compounds were applied to the plate are shown in Supplementary Materials Figure S1.

