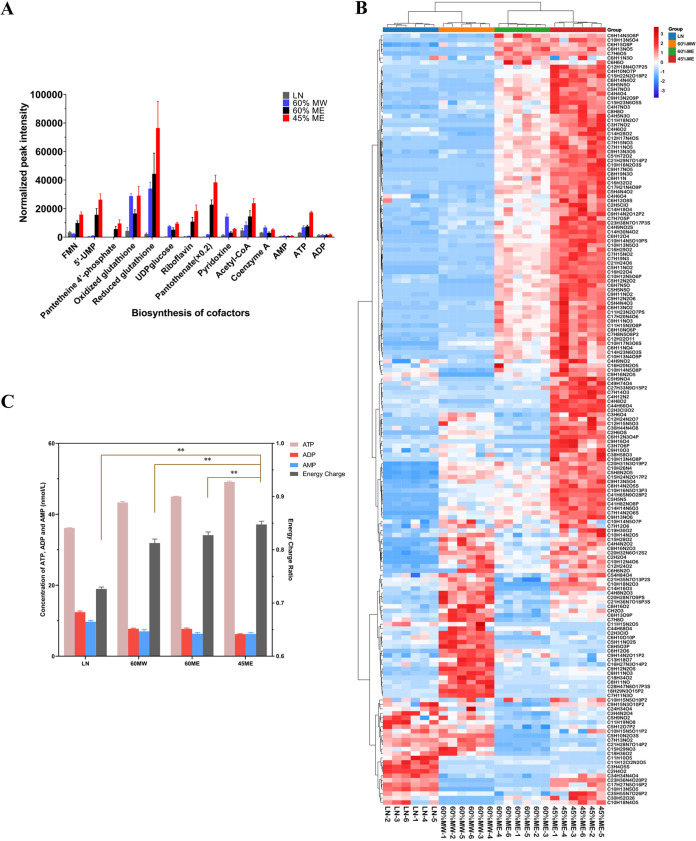
FIG 1.
Quenching solvent optimization. (A) Abundance of representative identified metabolites using different quenching methods. (B) Hierarchical clustering analysis of representative detectable features of E. coli obtained using LN, 60% MW, 60% ME, and 45% ME quenching approaches. (C) Comparison of intracellular ATP, ADP, AMP, and energy charge of E. coli obtained following LN, 60% MW, 60% ME, and 45% ME quenching.

