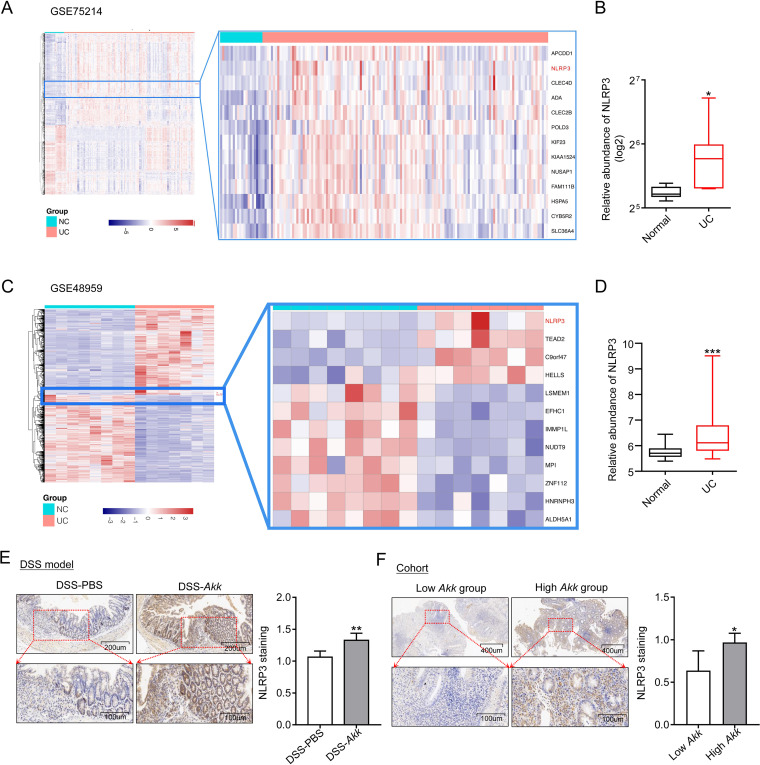
FIG 4.
A. muciniphila abundance correlates with the expression of NLRP3 in colitis. (A and C) Heatmap hierarchically demonstrated DEGs in the GSE75214 and GSE48959 ulcerative colitis group compared with normal patients. Red and blue indicate higher expression and lower expression, respectively (GSE75214: NC = 20, UC = 135; GSE48959: NC = 8, UC = 7). (B and D) The relative expression of NLRP3 in the GSE75214 and GSE48959 cohorts. (E) Representative abundances of NLRP3 were tested in the colon tissues from PBS- and A. muciniphila-gavaged mice with DSS treatment by immunohistochemical staining; n = 5 per group. (F) The UC patients were divided into low- and high-A. muciniphila groups according to the tissue abundance of A. muciniphila (-ΔCT), and then the abundances of NLRP3 from the low-A. muciniphila and high-A. muciniphila groups were explored by immunohistochemical staining; n = 6 per group. Data are expressed as the mean ± SD. *, P < 0.05; **, P < 0.01; ***, P < 0.001 (Mann-Whitney test or unpaired Student’s t test).

