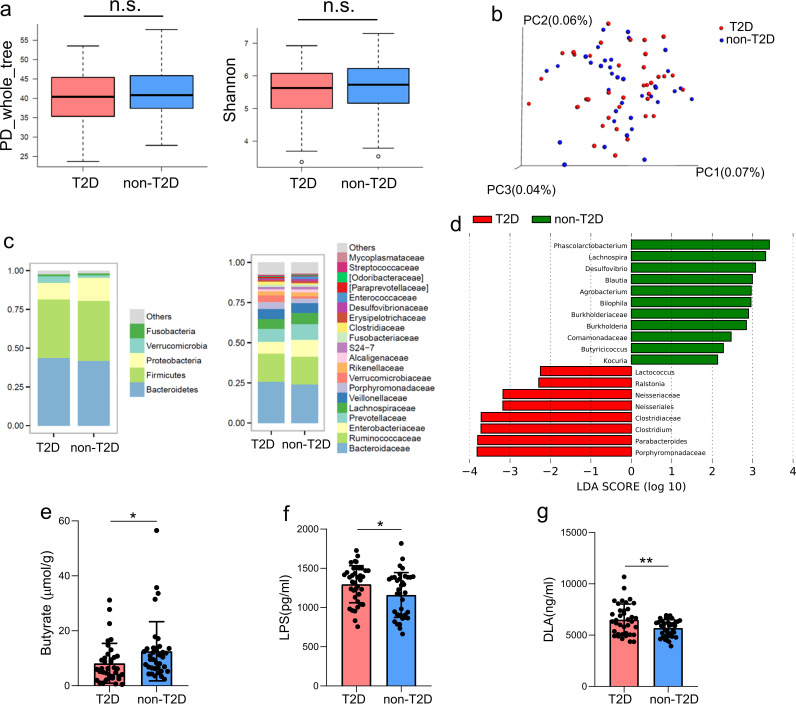
FIG 1.
Gut microbiota, fecal butyrate, and plasma LPS and DLA levels in patients with AIS who presented with or without T2D. (a) α-Diversity calculated using PD whole-tree and Shannon indices in patients with AIS who presented with or without T2D. (b) PCoA of β-diversity based on unweighted UniFrac distances showing the gut microbiota composition among patients with AIS who presented with or without T2D. (c) Average relative abundances of prevalent microbiota at the phylum and family levels in the two groups. (d) LEfSe showing bacterial taxa with significantly different abundances between the two groups. (e to g) Comparison of fecal butyrate levels (e) and plasma LPS (f) and DLA (g) levels between the two groups. n = 37 patients per group. Data are presented as mean values ± SD. *, P < 0.05; **, P < 0.01.

