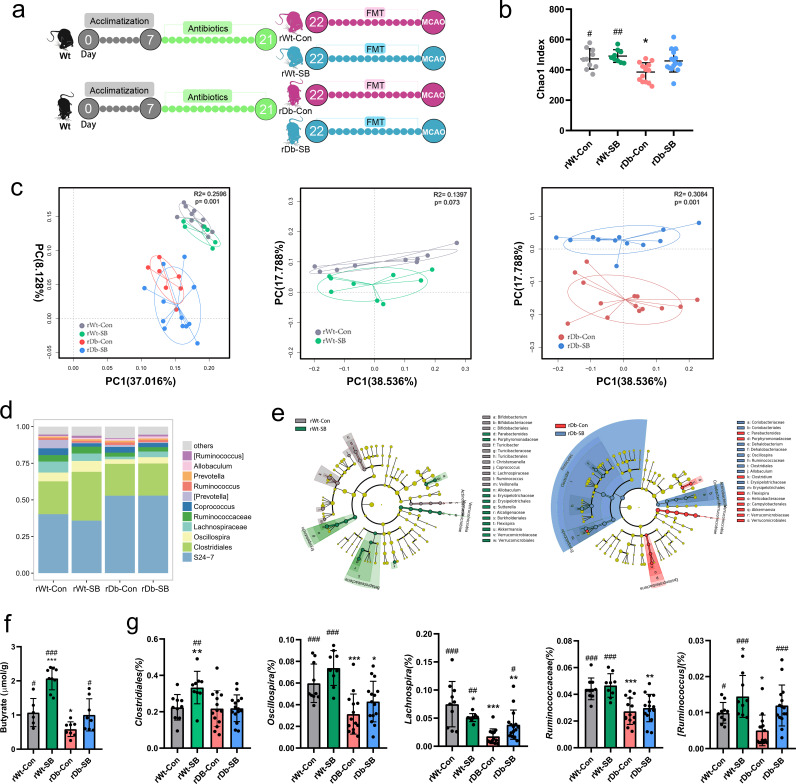
FIG 4.
Gut microbiota profiles and fecal concentrations of butyrate in recipient mice after FMT. (a) Experimental design for recipient mice. After acclimatization, the recipient mice were administered a cocktail of antibiotics for 14 days and then underwent FMT for an additional 14 days. After FMT, the recipient mice were subjected to MCAO for 1 h and sacrificed after 24 h of reperfusion. (b) α-Diversity measured using the Chao-1 index in the four groups. (c) PCoA plot of unweighted UniFrac distances between the rWT and rDb groups. (d) Average relative abundances of predominant taxa at the genus level in the four groups. (e) LEfSe showing bacterial taxa with significantly different abundances between groups. (f) Fecal concentrations of butyrate after 2 weeks of FMT. (g) The abundances of butyrate-producing bacteria in the four groups. n = 9 to 15 animals per group. Data are presented as mean values ± SD. Asterisks (*) show comparisons with the rWT-Con group, and pound signs (#) show comparisons with the rDb-Con group. *, P < 0.05; **, P < 0.01; ***, P < 0.001; #, P < 0.05; ##, P < 0.01; ###, P < 0.001.

