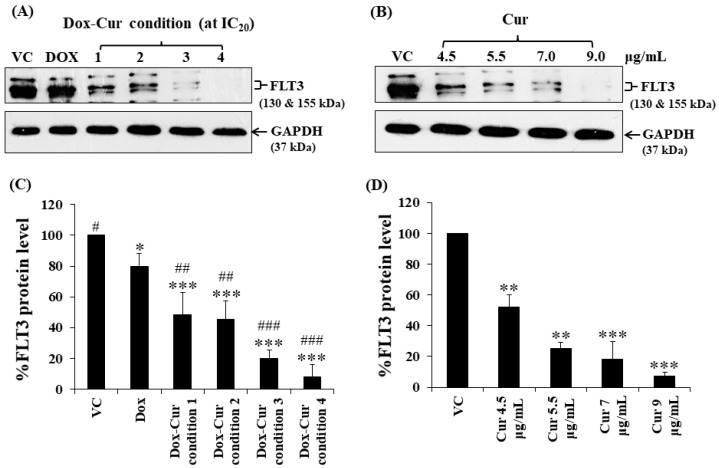
Figure 2.
FLT3 protein expression of KG-1a cells after treatment with Dox and combined treatment of Dox–Cur at concentration value of IC20 for 48 h. Protein bands (A) and percentage (C) of FLT3 protein expression level of KG-1a cells treated with DMSO (VC), Dox at concentration of 60 ng/mL, Dox–Cur condition 1 (15 ng/mL Dox + 4.5 µg/mL Cur), Dox–Cur condition 2 (16 ng/mL Dox + 5.5 µg/mL Cur), Dox–Cur condition 3 (12 ng/mL Dox + 7 µg/mL Cur), and Dox–Cur condition 4 (8 ng/mL Dox + 9 µg/mL Cur) for 48 h. Whole protein lysates (80 μg/lane) were loaded onto SDS-PAGE. Protein bands (B) and percentage (D) of FLT3 protein expression level of KG-1a cells treated with DMSO (VC), Cur (4.5 µg/mL), Cur (5.5 µg/mL), Cur (7 µg/mL), and Cur (9 µg/mL) for 48 h. The data are shown as mean ± SD from 3 independent experiments. The significance of mean differences was assessed using one-way ANOVA. * p < 0.05, ** p < 0.01, and *** p < 0.001 compared with VC. # p < 0.05, ## p < 0.01, and ### p < 0.001 compared with single-Dox treatment.

