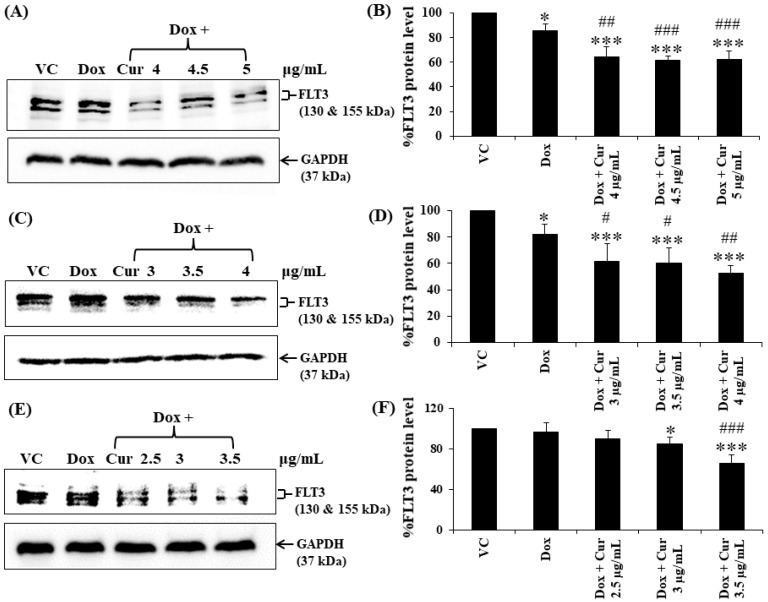
Figure 6.
FLT3 protein expression of KG-1a, KG-1, and EoL-1 cells following treatment with Dox and combination of fixed concentration of Dox and various non-toxic concentrations of Cur for 48 h. Protein bands (A) and percentage (B) of KG-1a cells treated with DMSO (VC), Dox (15 ng/mL), Dox + Cur (4 µg/mL), Dox + Cur (4.5 µg/mL), and Dox + Cur (5 µg/mL), for 48 h. Protein band (C) and percentage (D) of KG-1 cells treated with DMSO (VC), Dox (22 ng/mL), Dox + Cur (3 µg/mL), Dox + Cur (3.5 µg/mL), and Dox + Cur (4 µg/mL) for 48 h. Protein band (E) and percentage (F) of EoL-1 cells were treated with DMSO (VC), Dox (2.8 ng/mL), Dox + Cur (2.5 µg/mL), Dox + Cur (3 µg/mL), and Dox + Cur (3.5 µg/mL) for 48 h. Whole protein lysates (80 μg/lane) were loaded onto SDS-PAGE. The data are shown as mean ± SD from 3 independent experiments. The significance of mean differences was assessed using one-way ANOVA. * p < 0.05 and *** p < 0.001 compared with VC. # p < 0.05, ## p < 0.01, and ### p < 0.001 compared with single-Dox treatment.

