Figure 2.
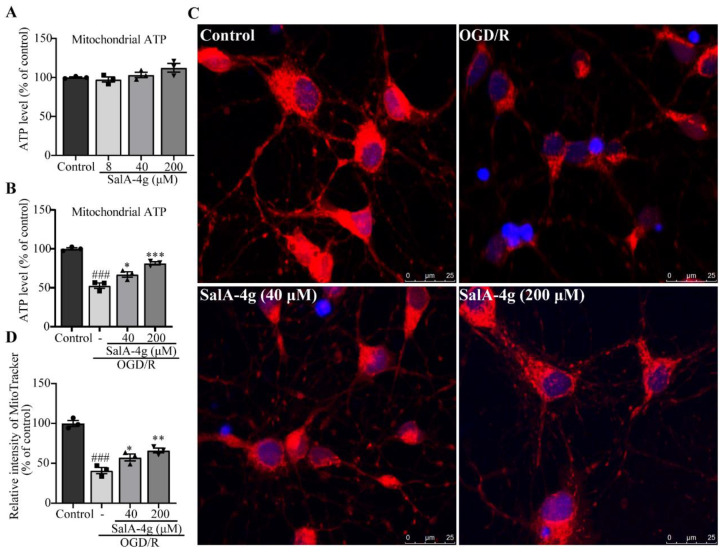
SalA-4g enhances mitochondrial bioenergy and activity in cortical neurons under OGD/R stress. (A) Histogram depicting the mitochondrial ATP levels in neurons exposed to different concentrations of SalA-4g for 24 h. (B) Histogram depicting the mitochondrial ATP levels of control cells, cells exposed to 2.5 h of OGD and 24 h of reoxygenation alone, and cells treated with different concentrations of SalA-4g during the OGD/R period. (C) Representative immunofluorescence of Mito-Tracker staining. Scale bar, 25 μm. (D) Histogram depicting the relative fluorescence intensity of Mito-Tracker in different groups. All values are presented as mean ± SEM (n = 3); ### p < 0.001 versus control; * p < 0.05, ** p < 0.01, *** p < 0.001 versus OGD/R alone.

