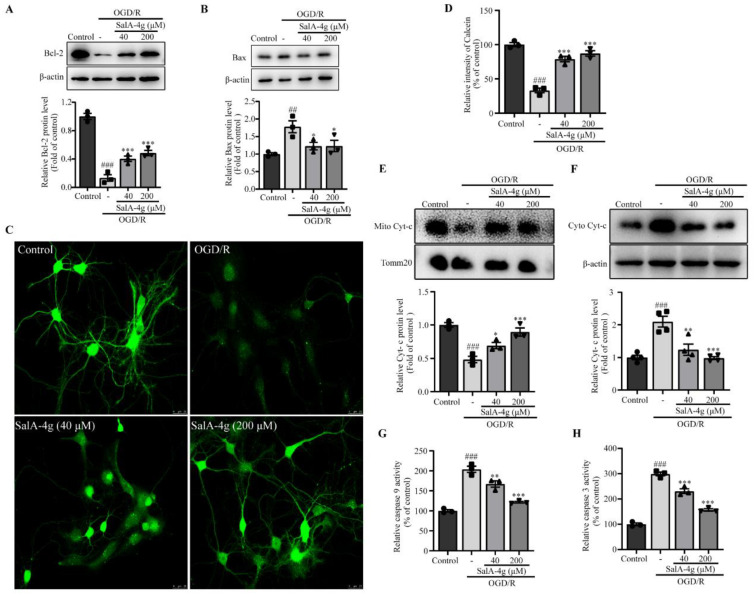
Figure 5.
SalA-4g inhibits mitochondrial apoptosis pathway in cortical neurons under OGD/R stress. (A,B) Western blot analysis of Bcl-2 (A) and Bax (B) expression of control cells, cells exposed to 2.5 h of OGD and 24 h of reoxygenation alone, and cells treated with different concentrations of SalA-4g during OGD/R period. (C,D) Representative fluorescence images (C) and quantification of average fluorescence intensity (D) of calcein in different groups. Scale bar, 25 μm. (E,F) Western blot analysis of cytochrome c expression in mitochondria (E) and cytosol (F) in different groups. (G,H) Histogram depicting the activation of caspase 9 (G) and caspase 3 (H) in different groups. All values are presented as mean ± SEM (n = 3 or 4); ## p < 0.01, ### p < 0.001 versus control; * p < 0.05, ** p < 0.01, *** p < 0.001 versus OGD/R alone.

