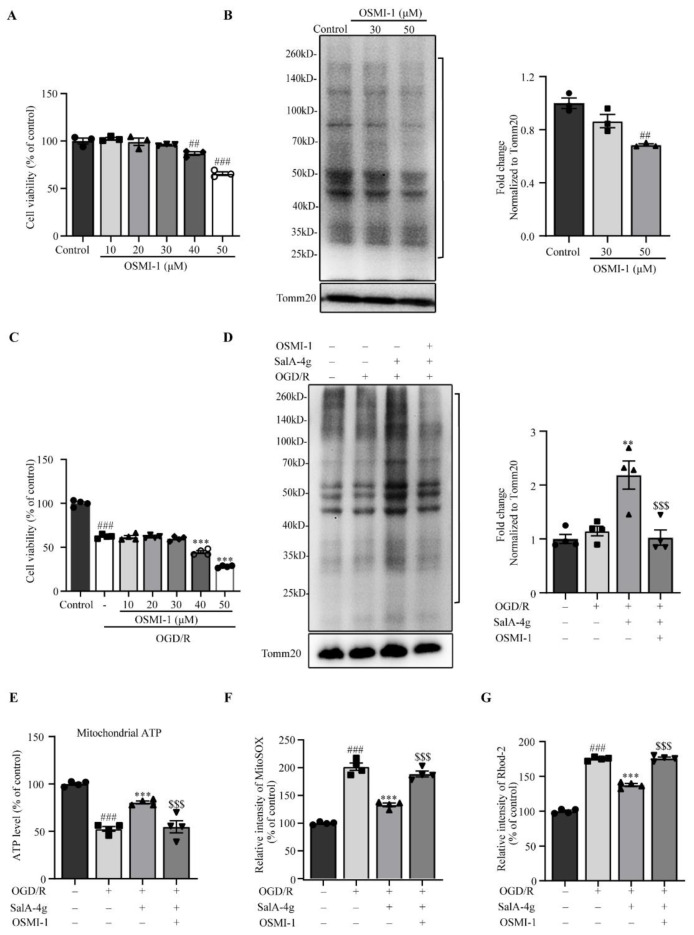
Figure 7.
O-GlcNAcylation on mitochondrial proteins is involved in the regulation of SalA-4g on mitochondrial stress response in cortical neurons under OGD/R stress. (A) Histogram depicting the cell viability of primary cortical neurons exposed to different concentrations of OSMI-1 for 24 h. (B) Western blot analysis of mitochondrial O-GlcNAcylation in neurons exposed to 30 μM and 50 μM of OSMI-1 for 24 h. (C) Histogram depicting the cell viability of control cells, cells exposed to 2.5 h of OGD and 24 h of reoxygenation alone, and cells treated with different concentrations of OSMI-1 during the OGD/R period. (D) Western blot analysis of mitochondrial O-GlcNAcylation in OGD/R injury neurons with treatment of SalA-4g (200 μM) or SalA-4g (200 μM) + OSMI-1 (30 μM). Regions between 25 kDa and 260 kDa marked by brackets were used to quantify levels of O-GlcNAcylation. (E) Histogram depicting the mitochondrial ATP levels in different groups. (F) The levels of mitochondrial superoxide in different groups. (G) Quantification of the fluorescence intensity of Rhod-2 in different groups. All values are expressed as mean ± SEM (n = 4); ## p < 0.01, ### p < 0.001 versus control; ** p < 0.01, and *** p < 0.001 versus OGD/R alone; $$$ p < 0.001 versus OGD/R + SalA-4g group.

