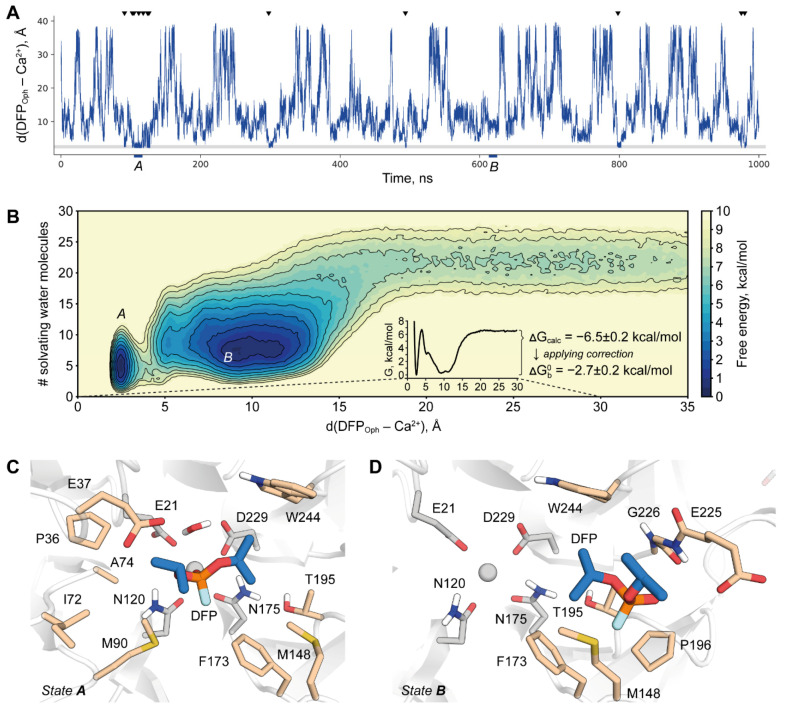
Figure 4.
Funnel metadynamics simulation of DFPase-DFP interaction upon binding. (A) Time progression of the simulation. Shaded gray area corresponds to Ca2+ coordination by phosphoryl oxygen. Black arrows indicate reaching the pre-reaction state. Time ranges used to extract frames of binding modes of interest are marked with capital letters. (B) Free energy profile of substrate binding. Minima corresponding to stable binding modes are marked with capital letters. (C) Pre-reaction state reached in the simulation. (D) The alternative stable state reached in the simulation. DFP carbon atoms are shown in blue, catalytic residues are colored gray and hydrophobic residues forming binding pockets for both states are shown in wheat. Non-polar hydrogen atoms are omitted for clarity.

