
Figure 2.
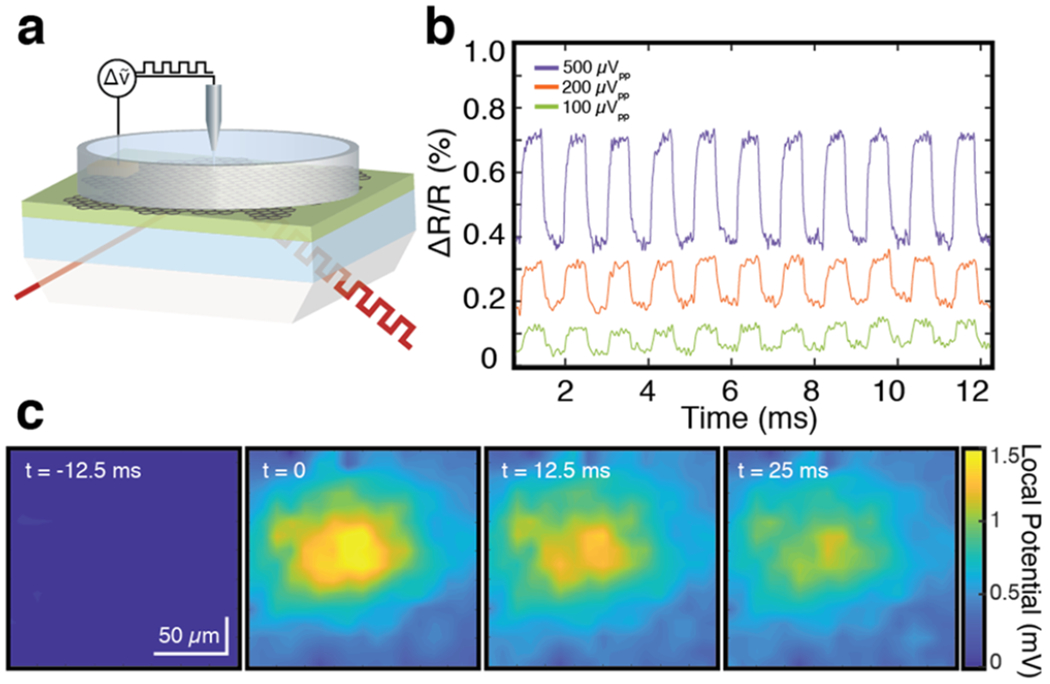
Demonstration of the CAGE working principle. (a) Schematic of the experimental setup in which a periodic square waveform is applied to the external electrode. The CAGE response is read out optically. (b) Optical CAGE detection of (a). Periodic peak-to-peak modulations of 500, 200, and 100 μVpp, are applied with a 10 Hz to 10 kHz bandpass filter. (c) CAGE 2D imaging. The application of a voltage pulse to the microelectrode creates a local electrical field that varies in both space and time. To form this spatially defined local potential distribution, a 10 mVpp 200 ms voltage pulse is applied to a platinum/iridium microelectrode with a 2 μm tip placed in solution 5 μm above the graphene surface of the detector. This spatially distributed electric field is optically captured by the graphene reflectivity. Spatially resolved field images are obtained by projecting the optical signal onto a 2D 80 Hz InGaAs camera. The reflectivity in each image is normalized to a frame without stimulation. Frames are separated by 12.5 ms.