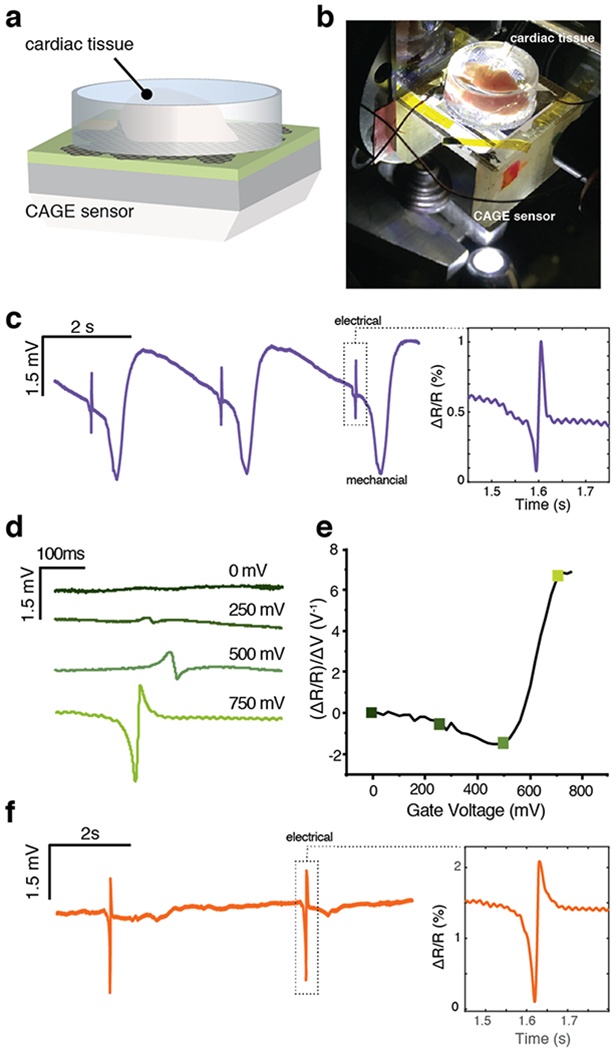
Figure 3.

Detection of the extracellular field potentials from primary cardiac tissue. (a) Schematic of the cardiac tissue in the sample chamber above the CAGE sensor. (b) Optical micrograph of the cardiac tissue in the sample chamber above the CAGE sensor. White light illumination from below permits simultaneous white light optical imaging through the objective (out of view). (c) Time traces of the optical response to cardiac tissue beating with well-resolved electrical and mechanical components. Inset: narrow time window around electrical signal. Reflection contrast (ΔR/R) corresponds to an extracellular potential of 1.36 mV. (d) Polarity change in optical response to the extracellular potential with varying graphene gate voltage. (e) The polarity of the detected extracellular potential follows graphene’s responsivity, demonstrating both responsivity to the electrical signal and the high sensitivity achieved with critical coupling. (f) After the measurement in (c), the addition of blebbistatin inhibits the mechanical beating of the cardiac tissue, while the electrical signal remains strong. Inset: narrow time window around electrical signal. Reflection contrast (ΔR/R) corresponds to an extracellular potential of 2.9 mV.
