
Figure 4.
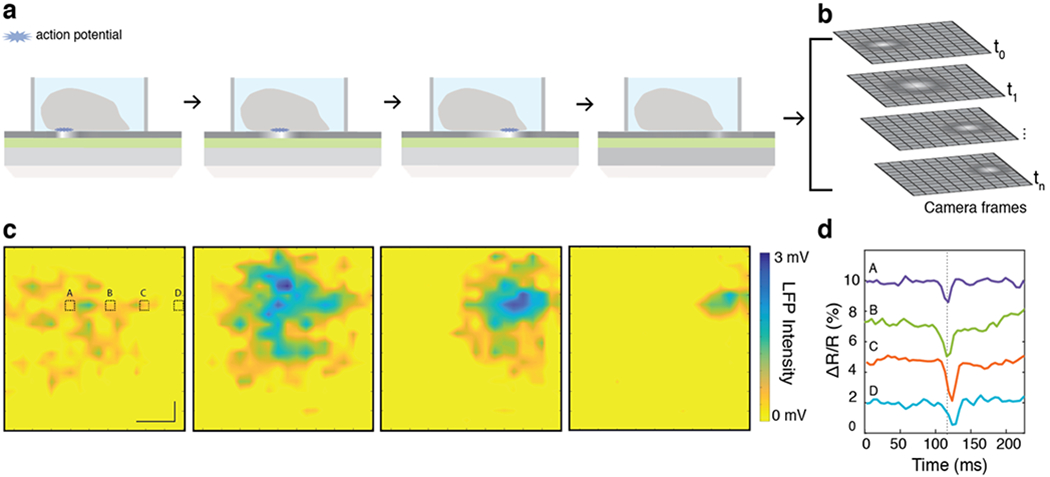
Label-free imaging of the extracellular potential wave. (a) Illustration of the experimental setup. Electrogenic cells or tissue are loaded into the sample chamber. When a cell fires an action potential (blue star), the optical absorption of graphene is locally modulated, resulting in an increase in the light reflected from that spatial position. (b) The response of the graphene sensor surface is imaged onto a 2D array, where time-series data maps the action potential propagation across the network. (c) CAGE imaging data maps the extracellular field potential propagation from spontaneously beating cardiac tissue across an ~2 mm2 field of view. The color axis maps the local field potential from 0 to 3 mV. From sequential frames, the action potential propagation is readily observed moving from left to right across the cardiac tissue. Time lapse between frames = 5 ms. Scale bar = 400 μm. (d) Signals (A–D) from areas outlined in (a) are plotted as time traces and resolve the time-delayed electrical response as it propagates across the tissue. The dashed line serves to guide the eye. Parameters, like the velocity of the signal propagation can be quantitatively determined (here, 14 cm/s, propagating left-to-right).