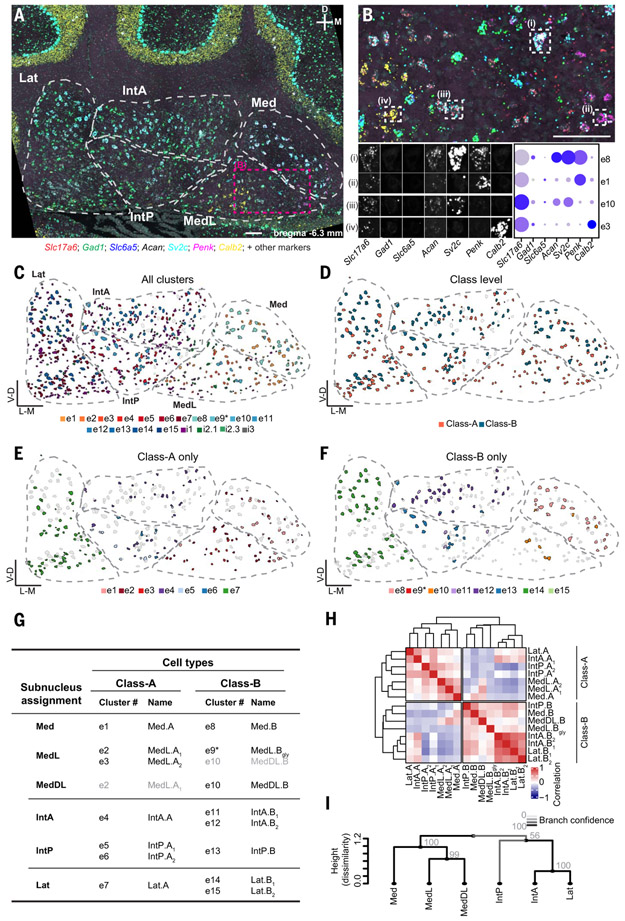
Fig. 3. Spatial organization of mouse cell types.
(A) A STARmap coronal section of the cerebellar nuclei, showing seven markers for illustration; representative of two animals, each including two hemispheres of three to six coronal sections spanning the anterior–posterior axis of the cerebellar nuclei. Cytoarchitectonic subnuclei boundaries are indicated. Scale bar, 100 μm. (B) Enlargement of the area marked in (A). Scale bar, 100 μm. Four excitatory cells are marked and decomposed into the seven illustrated STARmap channels. Comparison to snRNAseq data (dot plot) yields the classification of the cells into transcriptomic cell types. (C to F) Classification results of the same section shown in (A). All excitatory and inhibitory neurons are colored by their assigned transcriptomic cell type in Fig. 2C; excitatory neurons only colored by class (D); Class-A–only (E) and Class-B–only (F) excitatory neurons colored by their transcriptomic cluster showing subnuclei specificity. Unassigned neurons are in gray. (G) Summary of STARmap results for all excitatory cell types, noting the location of each cell type and new cell type names. Gray entries signify minor contributions to the indicated subnuclei. (H) Correlation matrix of all excitatory cell types annotated by subnuclei location. IntA correlates well with Lat in both Class-A and Class-B, whereas IntP is more similar to medial nucleus cell types. (I) Hierarchical clustering of subnuclei. Line color and numbers indicate bootstrapping-based branch confidence.

