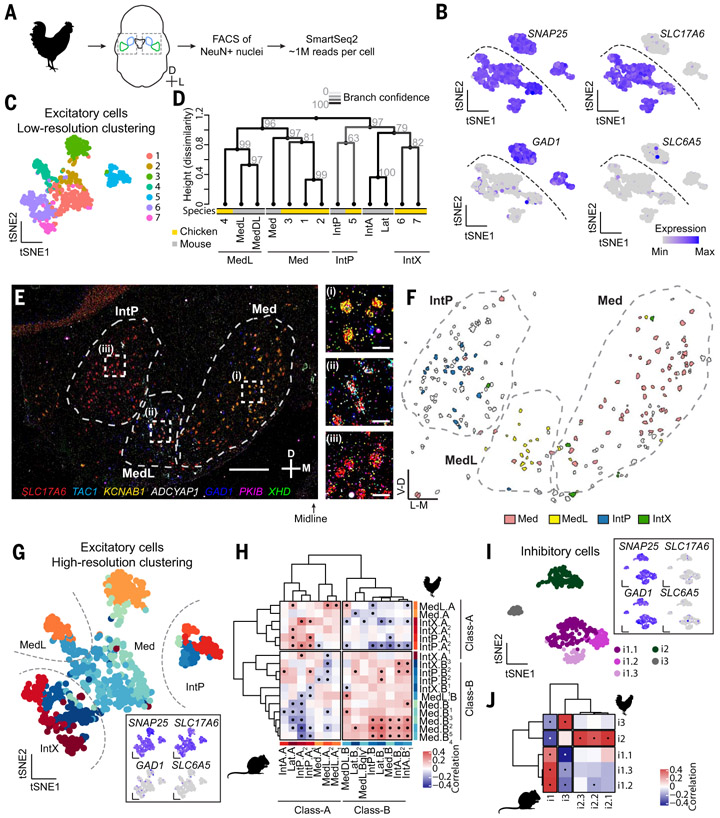
Fig. 4. Cerebellar nuclei cell types in the chicken.
(A) Workflow for chicken snRNAseq. The entire cerebellar nuclei were dissected together from frozen tissue. (B) Marker expression in all neurons. Dashed line divides excitatory and inhibitory neurons. N = 3 chickens. (C) Coarse clustering result of all excitatory neurons. (D) Dendrogram showing hierarchical clustering of coarse excitatory chicken clusters and mouse excitatory neurons averaged by subnuclei. Line color and gray numbers indicate bootstrapping-based branch confidence. (E) A STARmap coronal section of the chicken cerebellar nuclei, representative of N = 7 sections from three animals. Scale bar: main panel, 500 μm; inset, 50 μm. (F) Classification results of the excitatory cells shown in (E) into subnuclei inferred in (D). The subnuclei form spatially distinct structures. Unassigned neurons are in gray. (G) High-resolution clustering results of chicken excitatory neurons. Inset shows marker expression. (H) Correlation matrix between mouse and chicken excitatory cell types. A division of chicken excitatory neuron types into Class-A and Class-B is apparent. Dots indicate significant correlations. (I) Clustering results of inhibitory neurons. Inset shows marker expression. (J) Correlation matrix between mouse and chicken inhibitory neurons. Dots indicate significant correlations.

