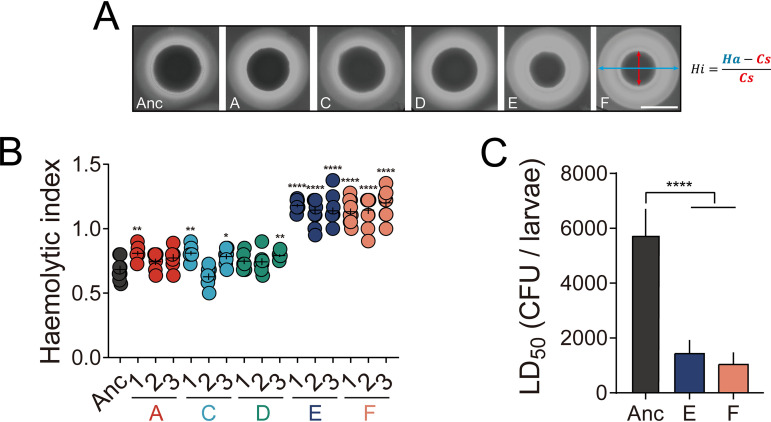
FIG 5.
Pathogenesis of the ancestor and evolved isolates. (A) Representative images of hemolytic activity from ancestor and evolved isolate colonies. Hi, Ha, and Cs represent hemolytic indices, hemolytic areas, and colony sizes, respectively. Bar, 10 mm. (B) Hemolytic indices (as described in Materials and Methods). The central values (horizontal lines) represent the means (n = 8), while the error bars represent the standard errors of the means. Asterisks indicate significant differences between the values for each group and the ancestor (*, P < 0.05; **, P < 0.01; ****, P < 0.0001; two-tailed t test with Welch’s corrections). (C) LD50 values of ancestor and evolved isolates based on mortality toward insect larvae (Galleria mellonella). Bars represent mean LD50 values (n = 3), and error bars represent standard deviations. Asterisks indicate significant differences between each group and the ancestor (****, P < 0.0001; two-tailed t test with Welch’s corrections).

