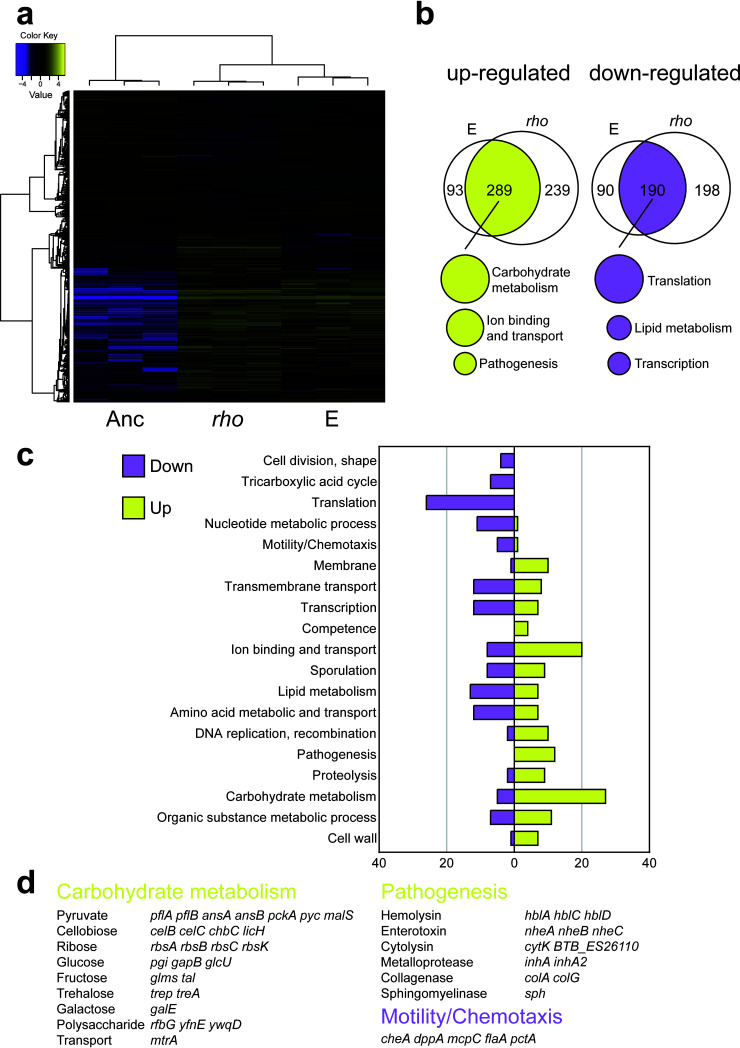
FIG 7.
An evolved isolate from lineage E and the rhoGlu54stop strain share similar differences of gene expression pattern compared with the ancestor. (a) Heatmap showing the relative expression levels of differentially expressed genes (DEGs) among the strains (n = 3 biologically replicates for each strain). TMM-normalized FPKM gene expression values were hierarchically clustered according to samples and genes. In the map, FPKM values are log2 transformed and median centered by gene. The color key gives the log2 value scale (negative and positive values represent gene expression below and above the median, respectively). (b) Venn diagrams of genes up- or downregulated in the evolved isolate from lineage E and the reconstructed rhoGlu54stop strain compared with the ancestor. The top functions of grouped DEGs are listed underneath the Venn diagrams. (c) Gene Ontology (GO) terms of the corresponding DEGs in the evolved strain and the rhoGlu54stop strain. (D) Representative functions and related DEGs. Yellow and magenta indicate up- and downregulated expression, respectively, in the evolved strain and the rhoGlu54stop strain relative to the ancestor.

